» Consul Installation to Minikube via Helm
In this guide, you'll start a local Kubernetes cluster with minikube. You'll install Consul with only a few commands, then deploy two custom services that use Consul to discover each other over encrypted TLS via Consul Connect. Finally, you'll tighten down Consul Connect so that only the approved applications can communicate with each other.
Demo code is available.
- Task 1: Start Minikube and Install Consul with Helm
- Task 2: Deploy a Consul Aware Application to the Cluster
- Task 3: Configure Consul Connect
» Prerequisites
Let's install Consul on Kubernetes with minikube. This is a relatively quick and easy way to try out Consul on your local machine without the need for any cloud credentials. You'll be able to use most Consul features right away.
First, you'll need to follow the directions for installing minikube, including VirtualBox or similar.
You'll also need to install kubectl and helm.
Mac users can install helm and kubectl with Homebrew.
$ brew install kubernetes-cli
$ brew install kubernetes-helm
Windows users can use Chocolatey with the same package names:
$ choco install kubernetes-cli
$ choco install kubernetes-helm
For more on Helm, see helm.sh.
» Task 1: Start Minikube and Install Consul with Helm
» Step 1: Start Minikube
Start minikube. You can use the --memory option with the equivalent of 4GB to 8GB so there is plenty of memory for all the pods we will run. This may take several minutes. It will download a 100-300MB of dependencies and container images.
$ minikube start --memory 4096
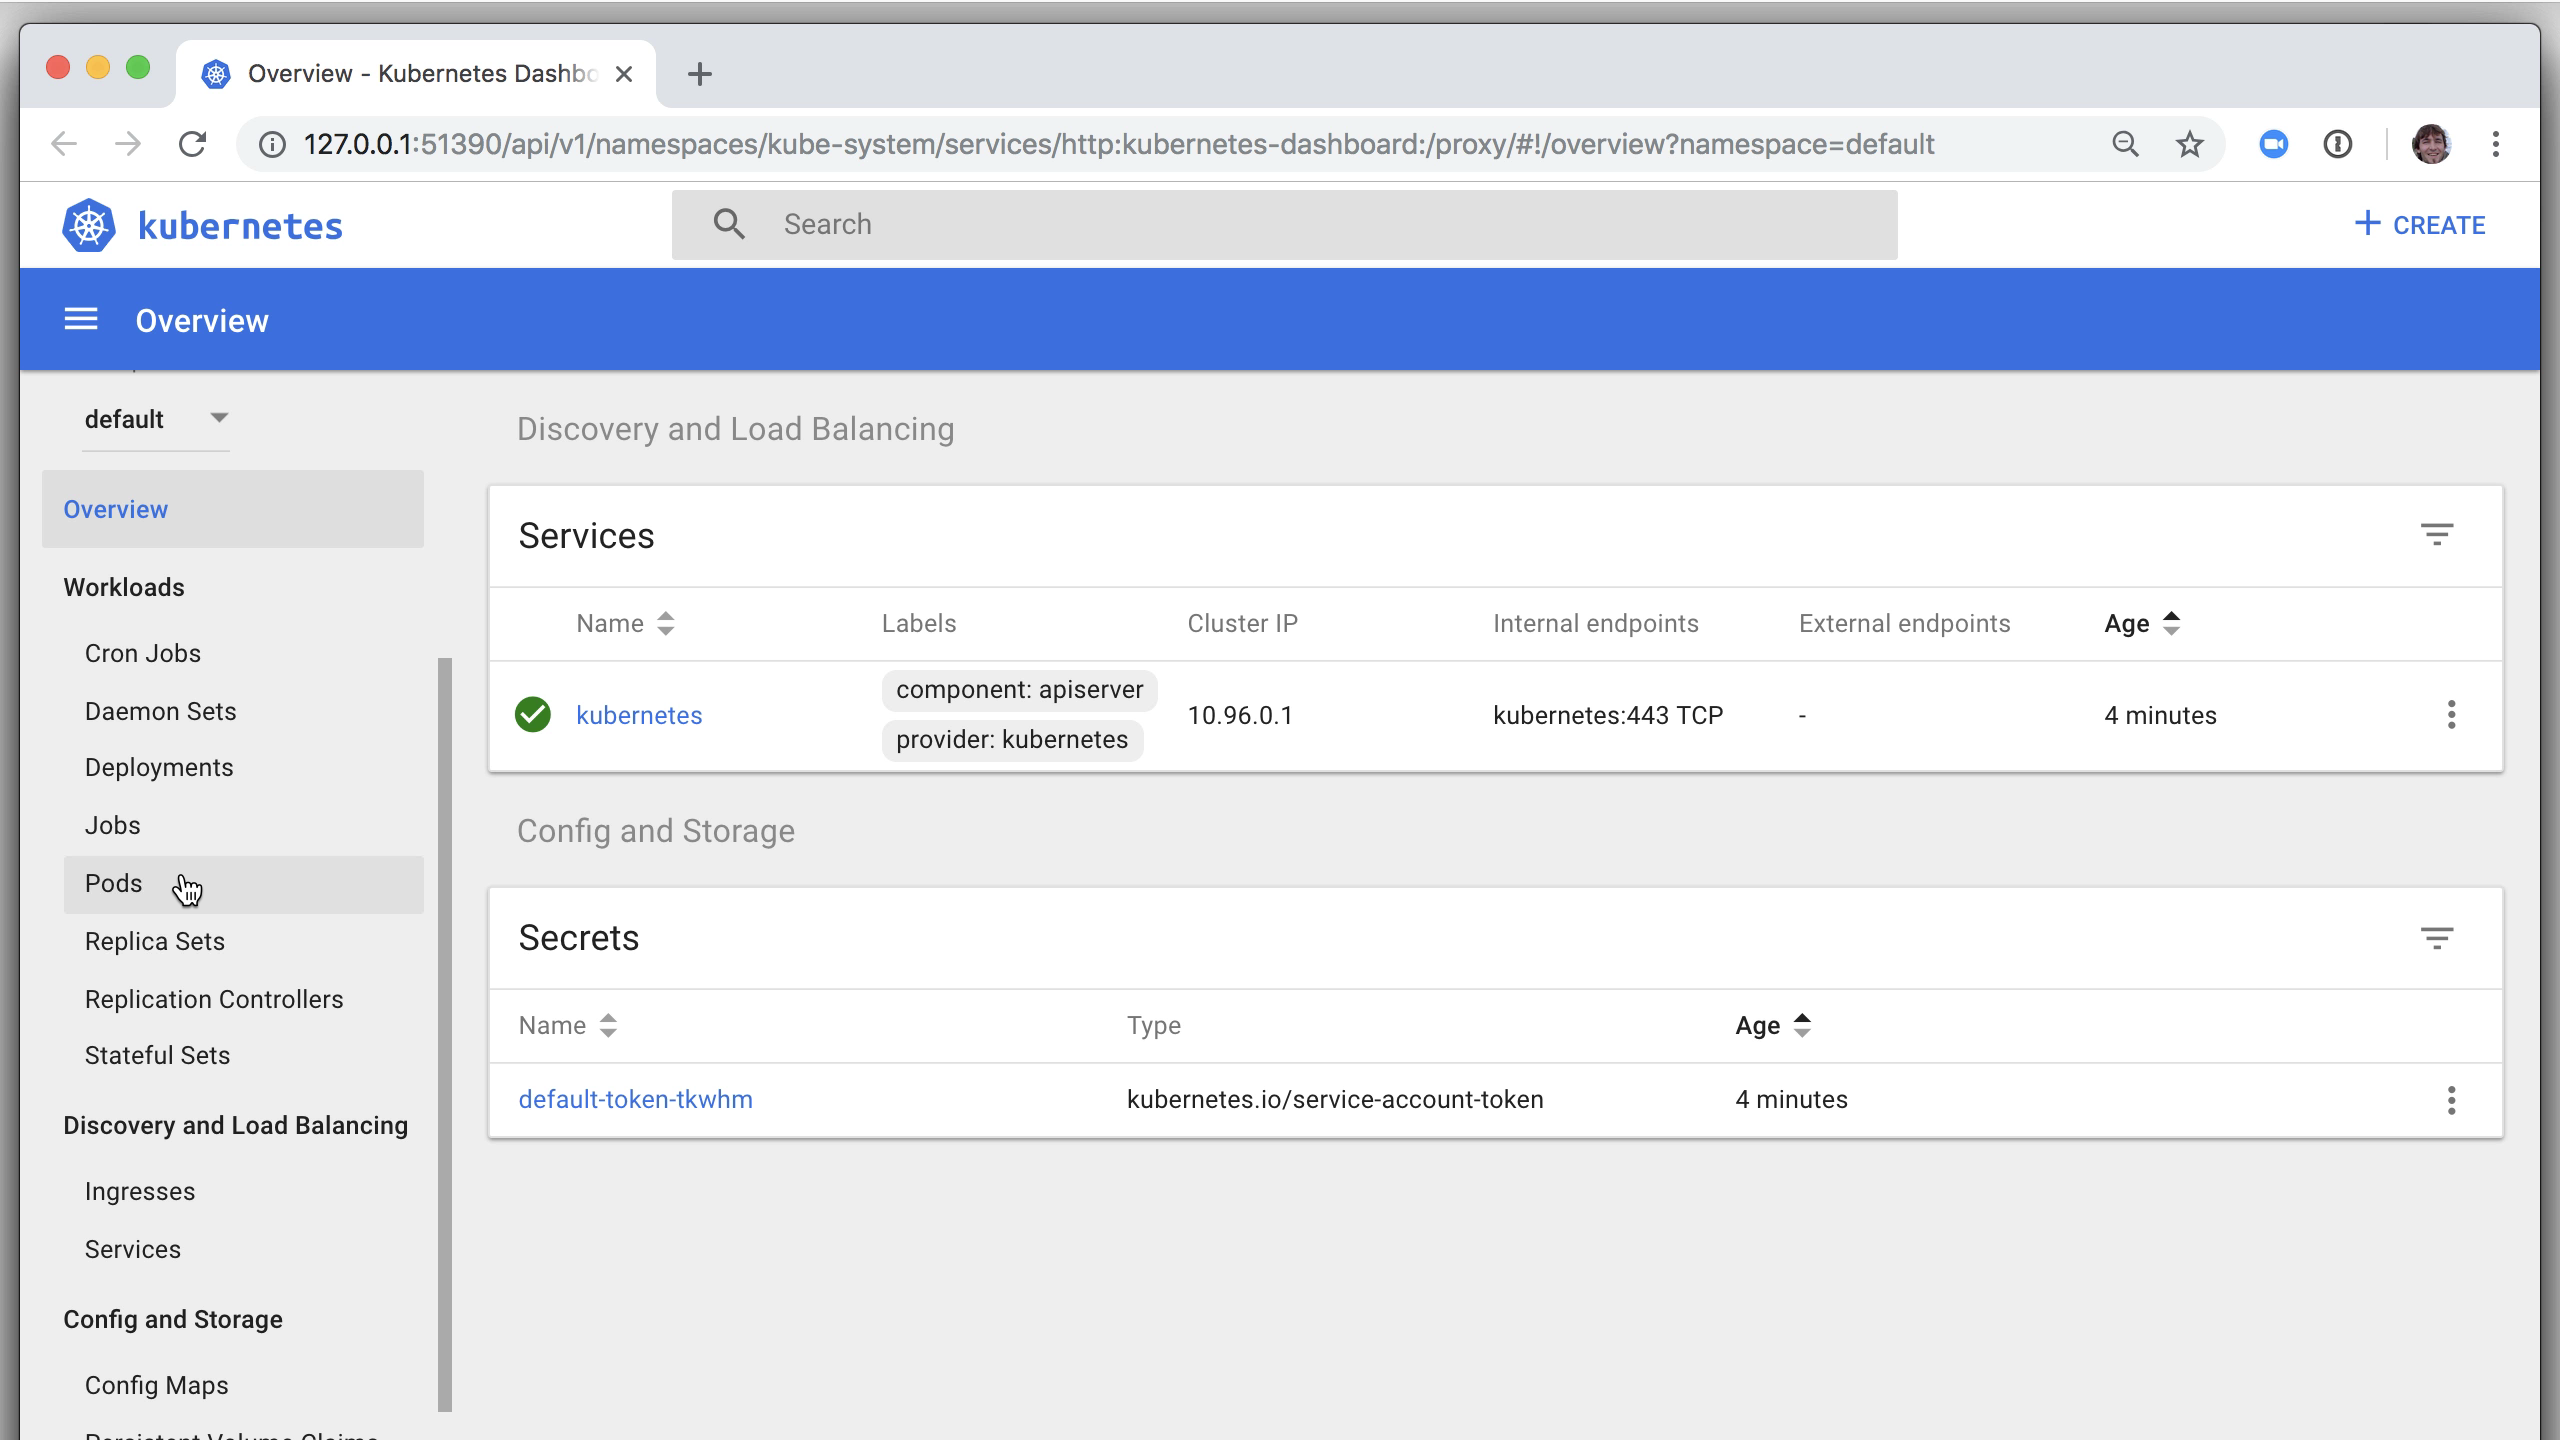
Next, let's view the local Kubernetes dashboard with minikube dashboard. Even if the previous step completed successfully, you may have to wait a minute or two for minikube to be available. If you see an error, try again after a few minutes.
Once it spins up, you'll see the dashboard in your web browser. You can view pods, nodes, and other resources.
$ minikube dashboard
» Step 2: Install the Consul Helm Chart to the Cluster
To perform the steps in this lab exercise, clone the hashicorp/demo-consul-101 repository from GitHub. Go into the demo-consul-101/k8s directory.
$ git clone https://github.com/hashicorp/demo-consul-101.git

$ cd demo-consul-101/k8s
Now we're ready to install Consul to the cluster, using the helm tool. Initialize Helm with helm init. You'll see a note that Tiller (the server-side component) has been installed. You can ignore the policy warning.
$ helm init

$HELM_HOME has been configured at /Users/geoffrey/.helm.
Now we need to install Consul with Helm. To get the freshest copy of the Helm chart, clone the hashicorp/consul-helm repository.
$ git clone https://github.com/hashicorp/consul-helm.git
The chart works on its own, but we'll override a few values to help things go more smoothly with minikube and to enable useful features.
We've created helm-consul-values.yaml for you with overrides. See values.yaml in the Helm chart repository for other possible values.
We've given a name to the datacenter running this Consul cluster. We've enabled the Consul web UI via a NodePort. When deploying to a hosted cloud that implements load balancers, we could use LoadBalancer instead. We'll enable secure communication between pods with Connect. We also need to enable grpc on the client for Connect to work properly. Finally, specify that this Consul cluster should only run one server (suitable for local development).
# Choose an optional name for the datacenter
global:
  datacenter: minidc

# Enable the Consul Web UI via a NodePort
ui:
  service:
    type: "NodePort"

# Enable Connect for secure communication between nodes
connectInject:
  enabled: true

client:
  enabled: true
  grpc: true

# Use only one Consul server for local development
server:
  replicas: 1
  bootstrapExpect: 1
  disruptionBudget:
    enabled: true
    maxUnavailable: 0
Now, run helm install together with our overrides file and the cloned consul-helm chart. It will print a list of all the resources that were created.
$ helm install -f helm-consul-values.yaml --name hedgehog ./consul-helm
NOTE: If no --name is provided, the chart will create a random name for the installation. To reduce confusion, consider specifying a --name.
» Task 2: Deploy a Consul-aware Application to the Cluster
» Step 1: View the Consul Web UI
Verify the installation by going back to the Kubernetes dashboard in your web browser. Find the list of services. Several include consul in the name and have the app: consul label.

There are a few differences between running Kubernetes on a hosted cloud vs locally with minikube. You may find that any load balancer resources don't work as expected on a local cluster. But we can still view the Consul UI and other deployed resources.
Run minikube service list to see your services. Find the one with consul-ui in the name.
$ minikube service list
Run minikube service with the consul-ui service name as the argument. It will open the service in your web browser.
$ minikube service hedgehog-consul-ui
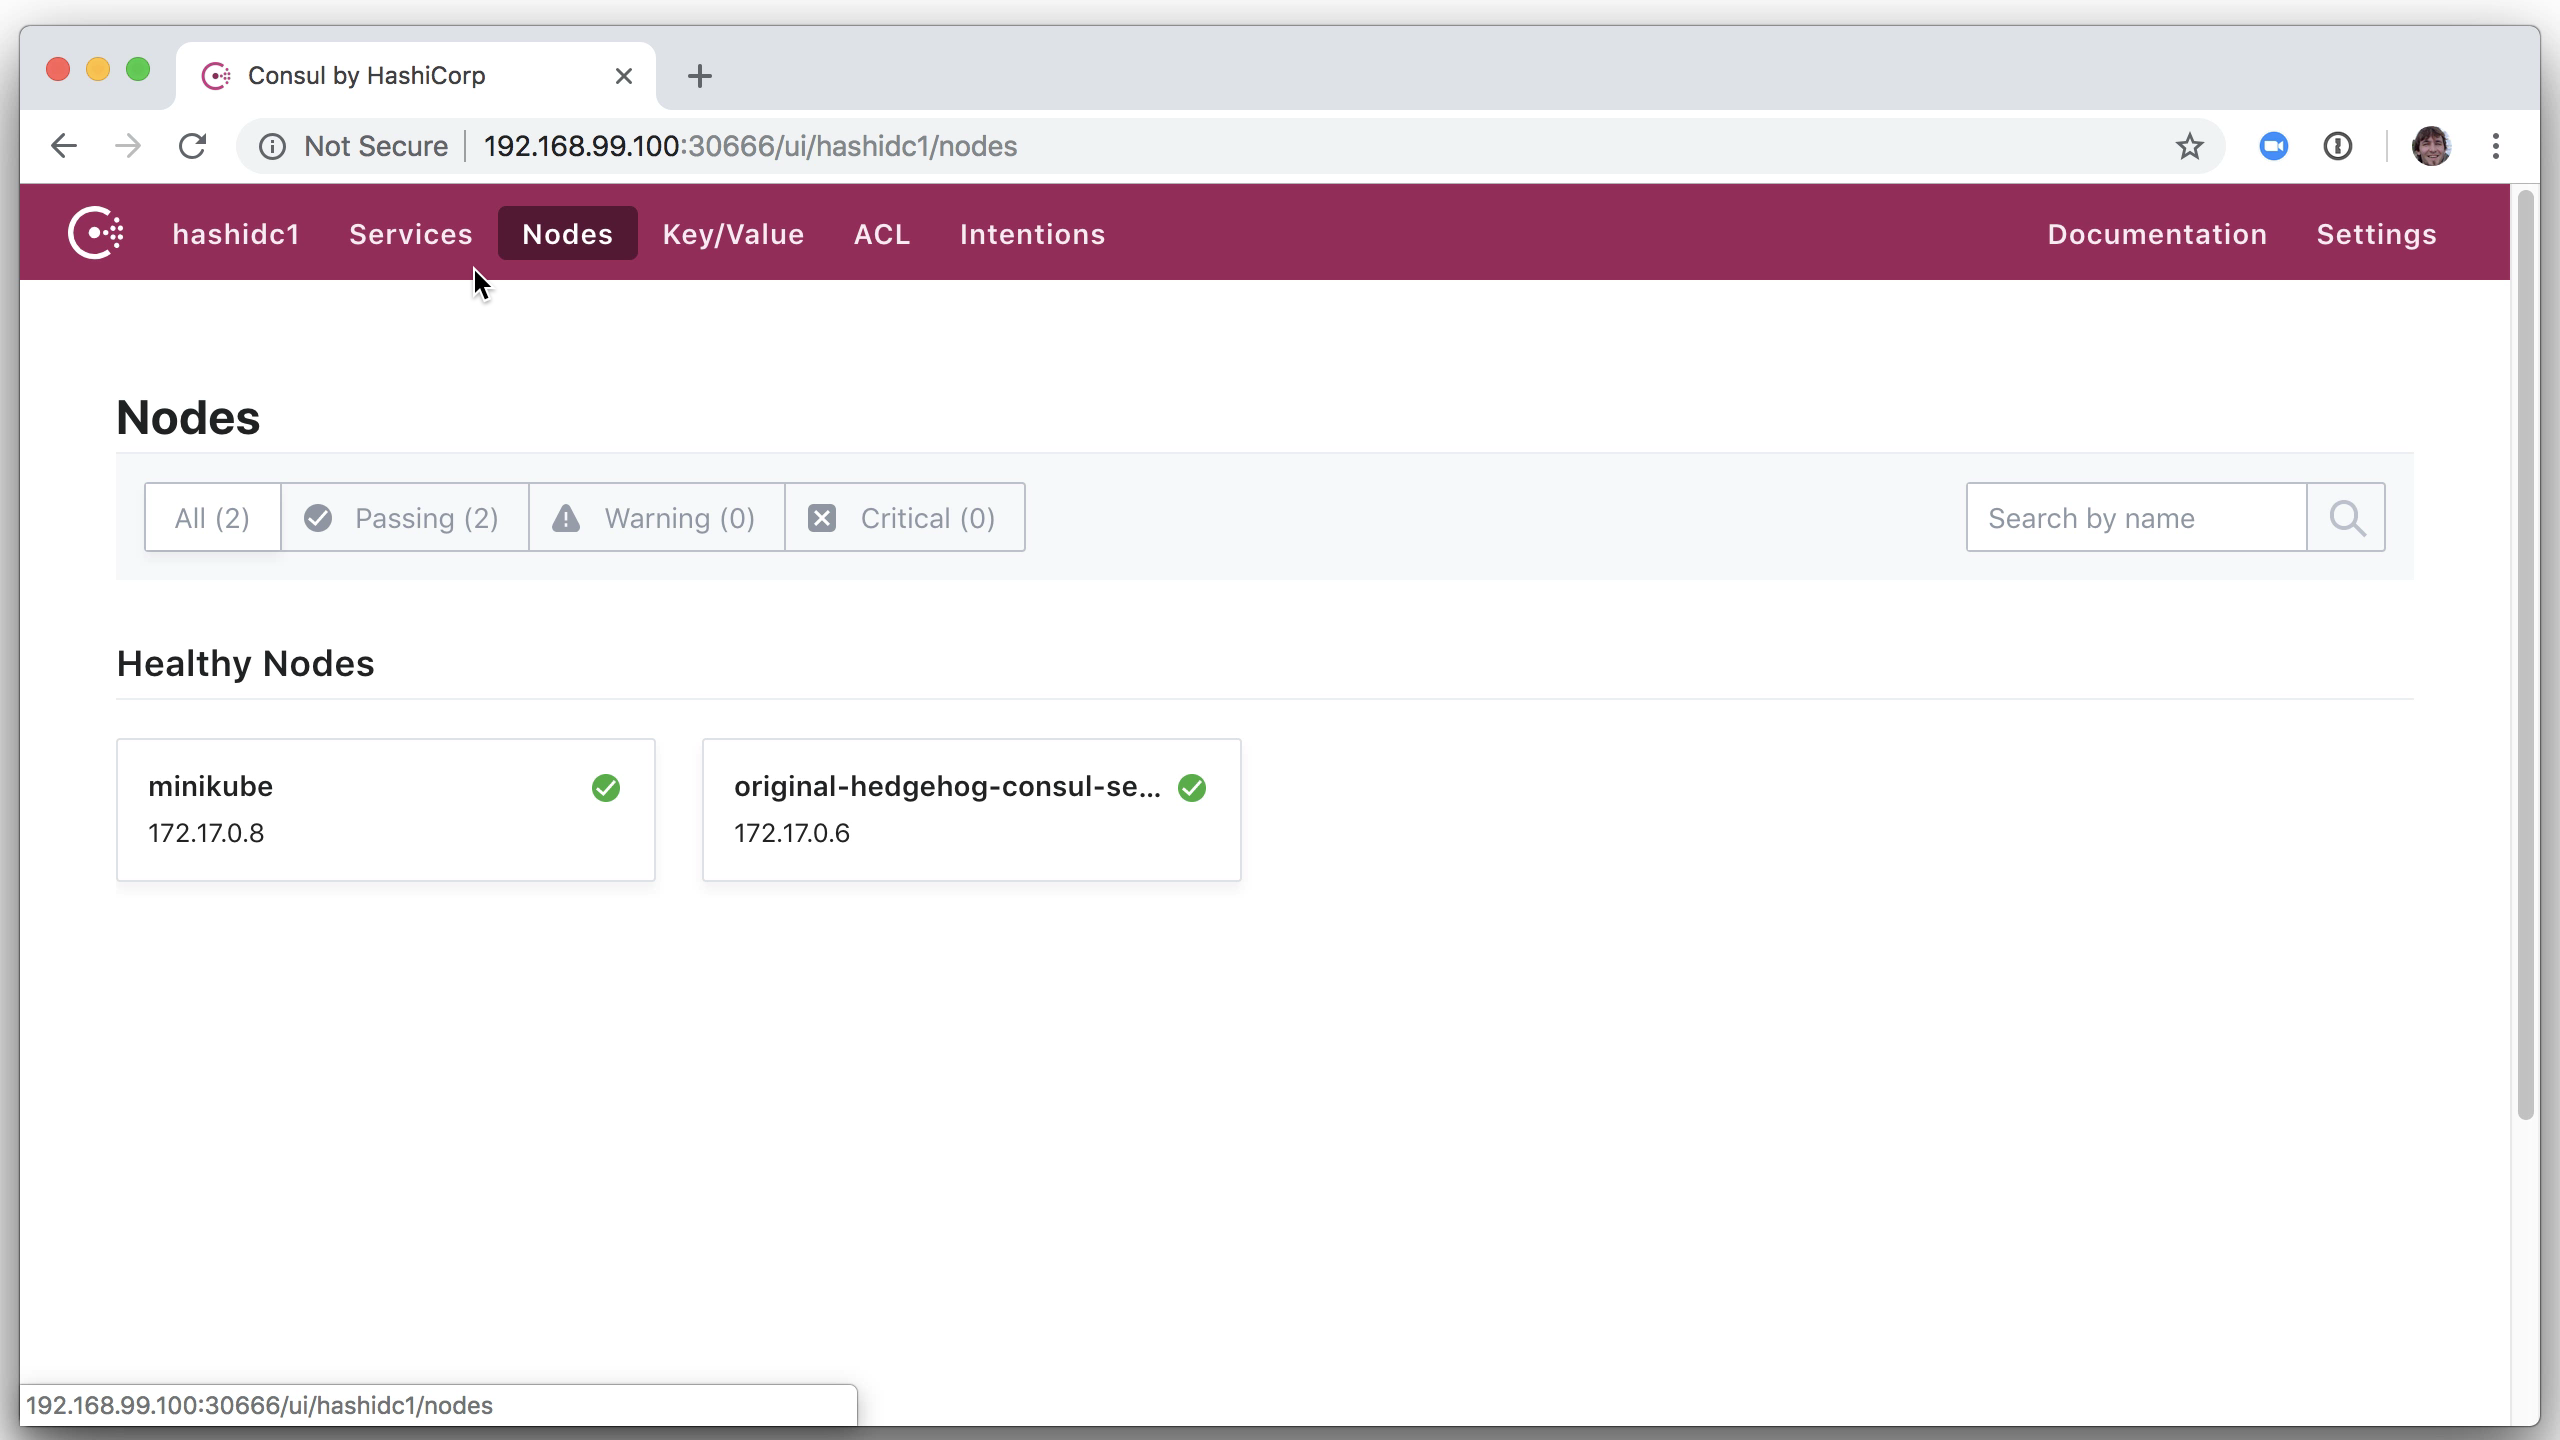
You can now view the Consul web UI with a list of Consul's services, nodes, and other resources.
» Step 2: Deploy Custom Applications
Now let's deploy our application. It's two services: a backend data service that returns a number (counting service) and a front-end dashboard that pulls from the counting service over HTTP and displays the number. The kubernetes part is a single line: kubectl create -f 04-yaml-connect-envoy. This is a directory with several YAML files, each defining one or more resources (pods, containers, etc).
$ kubectl create -f 04-yaml-connect-envoy
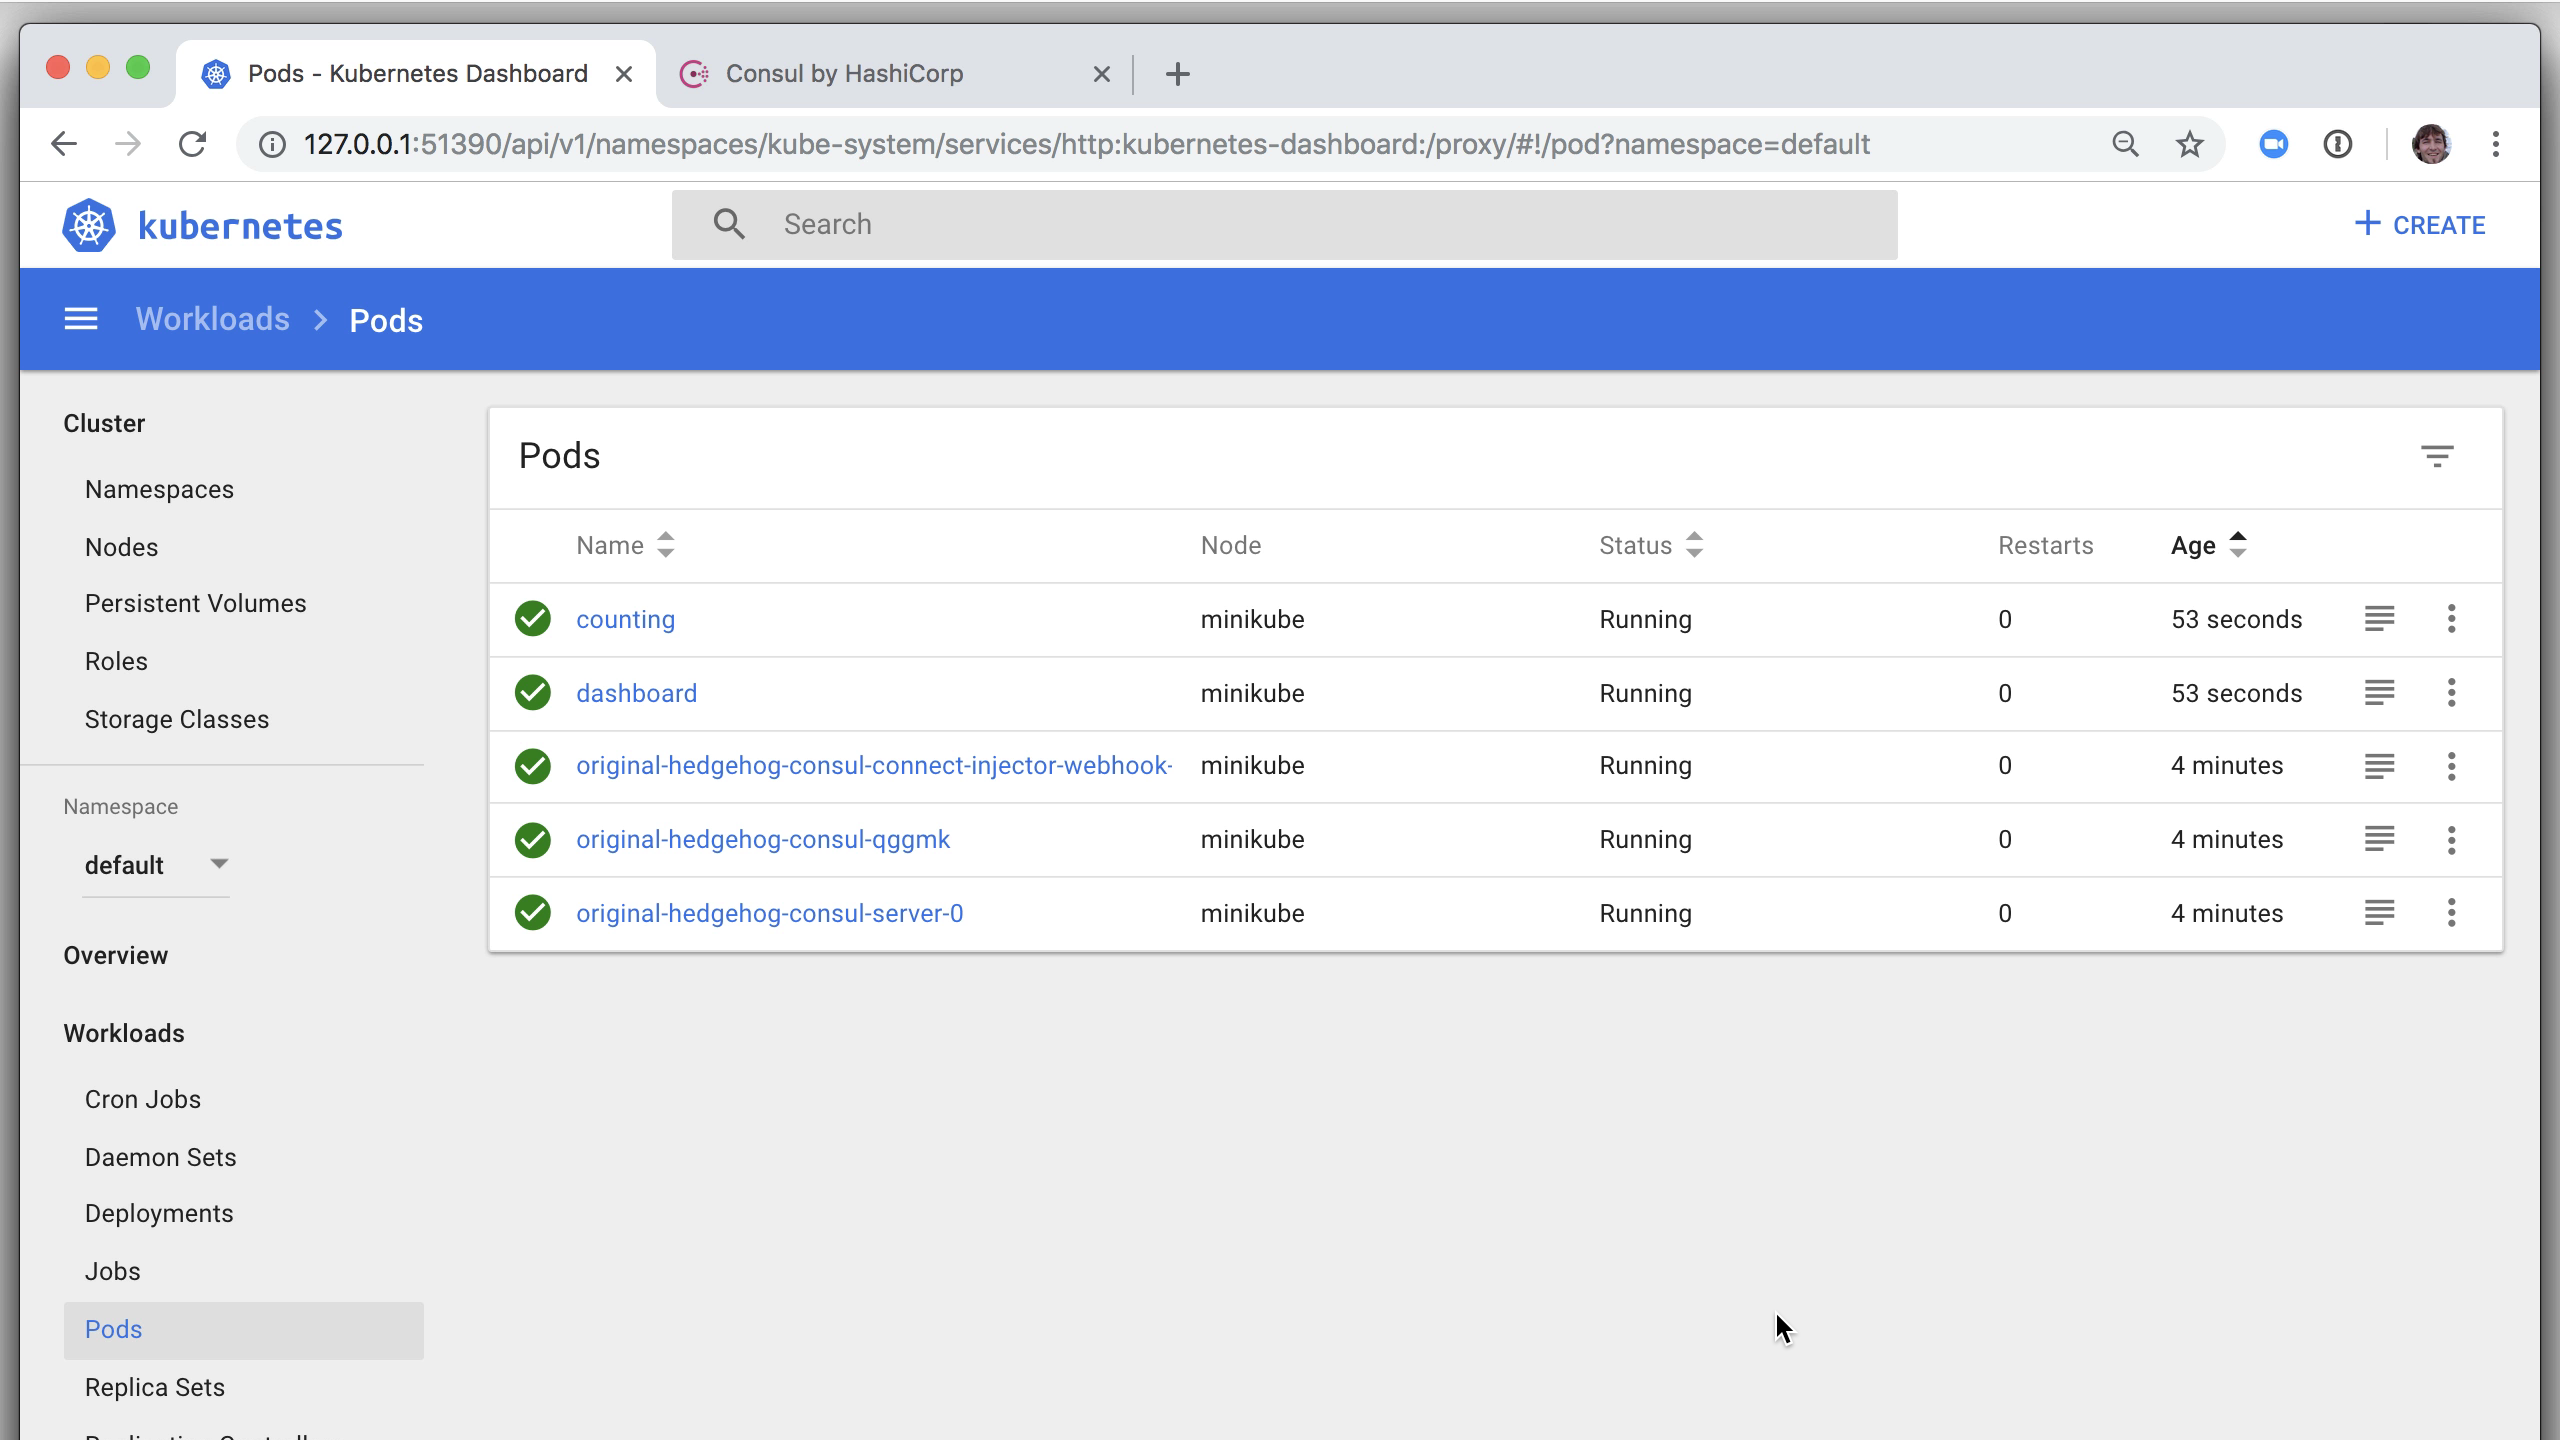
The output shows that they have been created. In reality, they may take a few seconds to spin up. Refresh the Kubernetes dashboard a few times and you'll see that the counting and dashboard services are running. You can also click a resource to view more data about it.
» Step 3: View the Web Application
For the last step in this initial task, use the Kubernetes port-forward feature for the dashboard service running on port 9002. We already know that the pod is named dashboard thanks to the metadata specified in the YAML we deployed.
$ kubectl port-forward dashboard 9002:9002
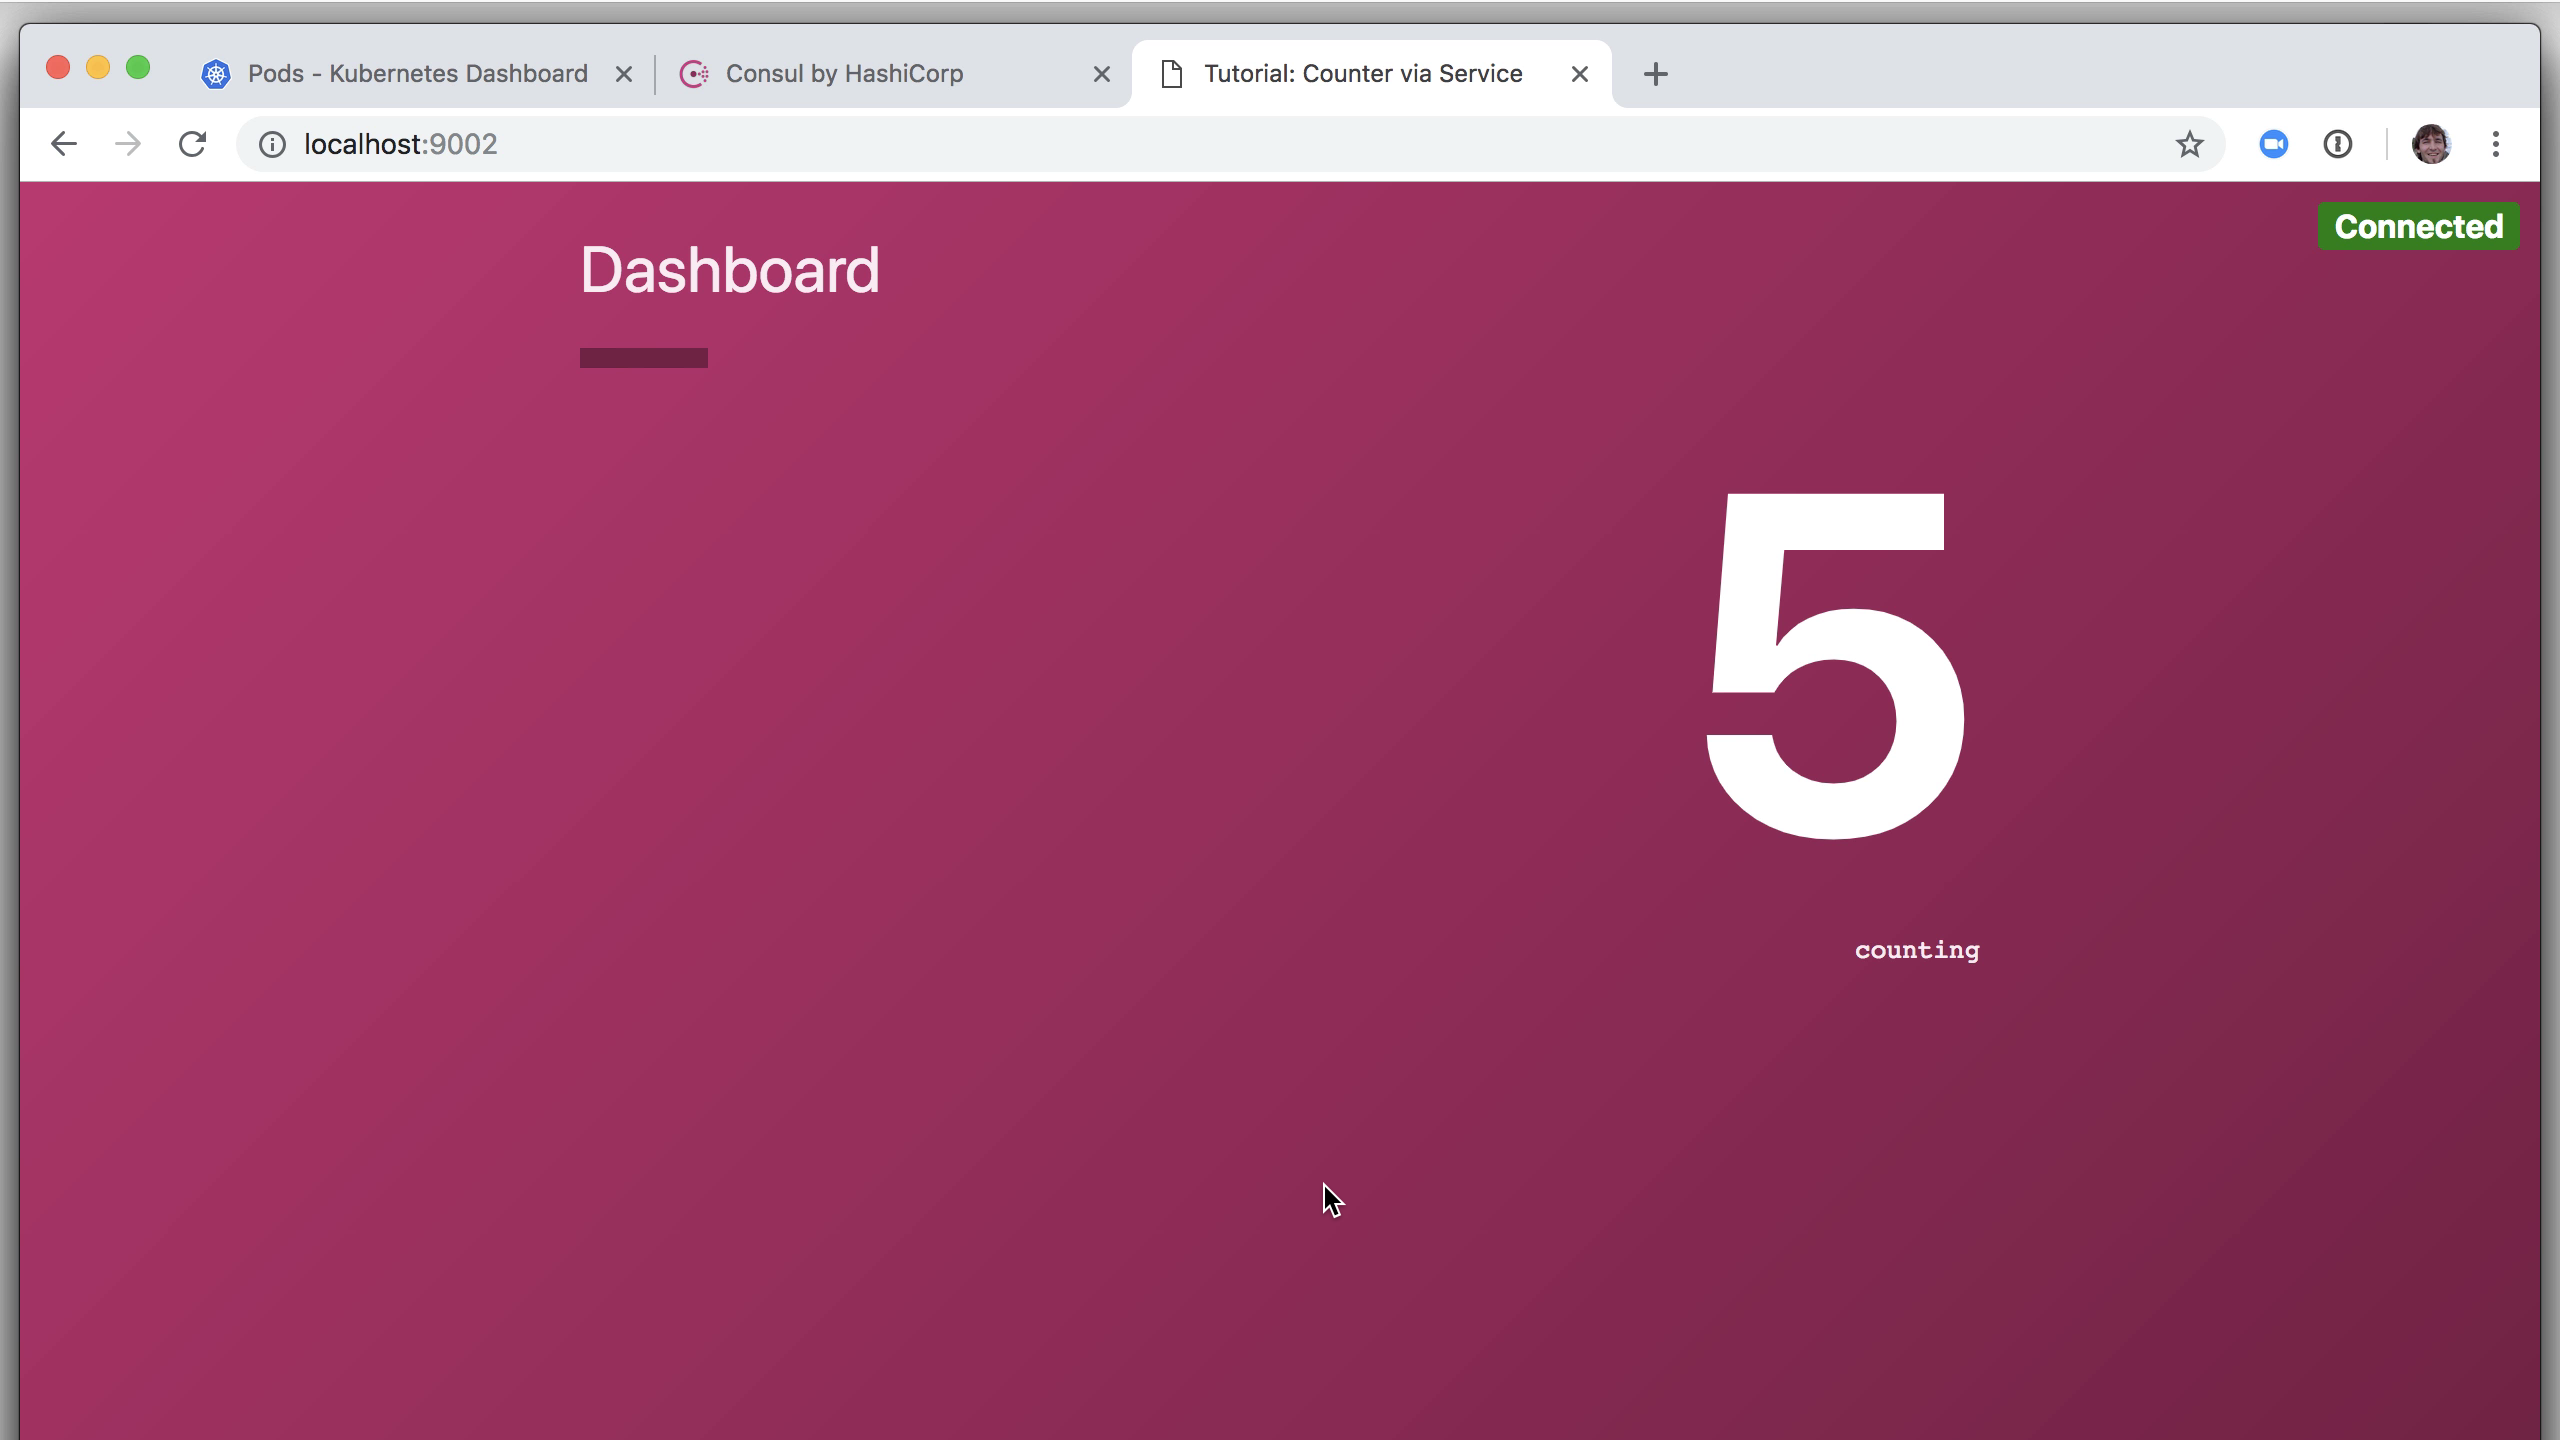
Visit http://localhost:9002 in your web browser. You'll see a running dashboard container in the kubernetes cluster that displays a number retrieved from the counting service using Consul service discovery and secured over the network by TLS via an Envoy proxy.
» Addendum: Review the Code
Let's take a peek at the code. Relevant to this Kubernetes deployment are two YAML files in the 04 directory. The counting service defines an annotation in the metadata section that instructs Consul to spin up a Consul Connect proxy for this service: connect-inject. The relevant port number is found in the containerPort section (9001). This Pod registers a Consul service that will be available via a secure proxy.
apiVersion: v1
kind: Pod
metadata:
  name: counting
  annotations:
    "consul.hashicorp.com/connect-inject": "true"
spec:
  containers:
  - name: counting
    image: hashicorp/counting-service:0.0.2
    ports:
    - containerPort: 9001
      name: http
# ...
The other side is on the dashboard service. This declares the same connect-inject annotation but also adds another. The connect-service-upstreams in the annotations section configures Connect such that this Pod will have access to the counting service on localhost port 9001. All the rest of the configuration and communication is taken care of by Consul and the Consul Helm chart.
apiVersion: v1
kind: Pod
metadata:
  name: dashboard
  labels:
    app: "dashboard"
  annotations:
    "consul.hashicorp.com/connect-inject": "true"
    "consul.hashicorp.com/connect-service-upstreams": "counting:9001"
spec:
  containers:
  - name: dashboard
    image: hashicorp/dashboard-service:0.0.3
    ports:
    - containerPort: 9002
      name: http
    env:
    - name: COUNTING_SERVICE_URL
      value: "http://localhost:9001"
# ...
Within our dashboard application, we can access the counting service by communicating with localhost:9001 as seen on the last line of this snippet. Here we are looking at an environment variable that is specific to the Go application running in a container in this Pod. Instead of providing an IP address or even a Consul service URL, we tell the application to talk to localhost:9001 where our local end of the proxy is ready and listening. Because of the annotation to counting:9001 earlier, we know that an instance of the counting service is on the other end.
This is what is happening in the cluster and over the network when we view the dashboard service in the browser.
TIP: The full source code for the Go-based web services and all code needed to build the Docker images are available in the repo.
» Task 3: Use Consul Connect
» Step 1: Create an Intention that Denies All Service Communication by Default
For a final task, let's take this a step further by restricting service communication with intentions. We don't want any service to be able to communicate with any other service; only the ones we specify.
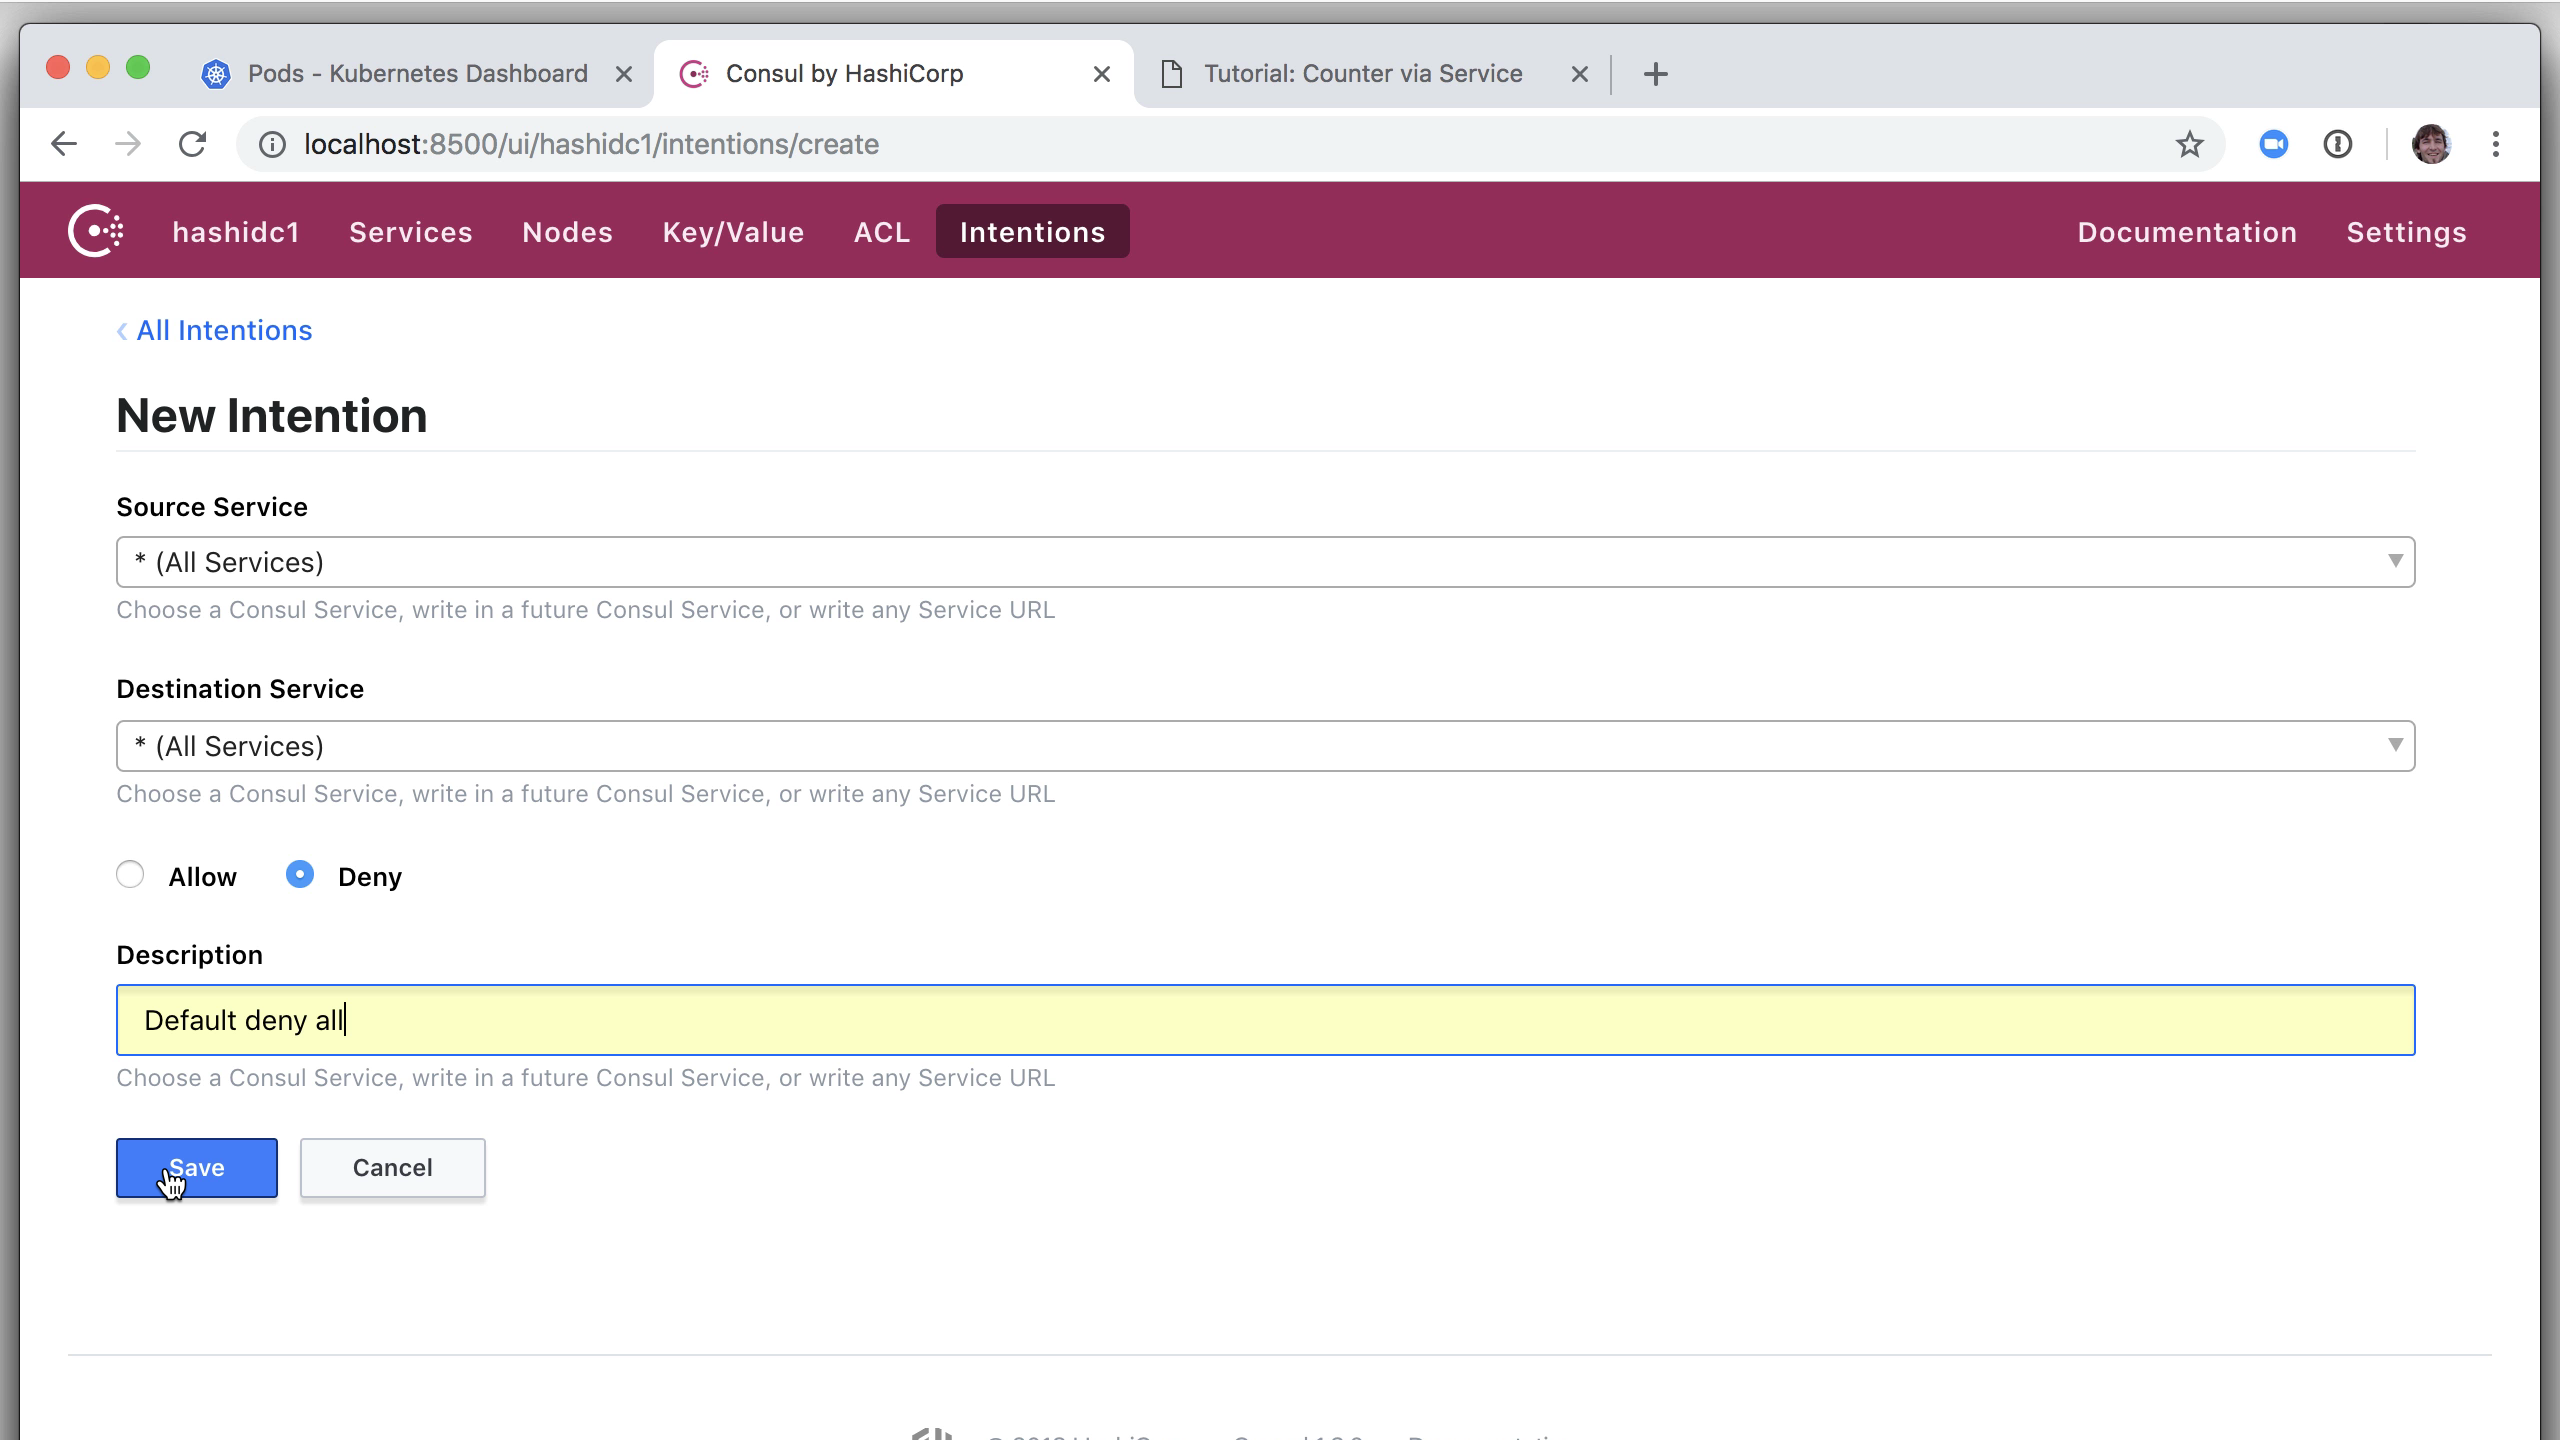
Begin by navigating to the Intentions screen in the Consul web UI. Click the "Create" button and define an initial intention that blocks all communication between any services by default. Choose * as the source and * as the destination. Choose the Deny radio button and add an optional description. Click "Save."
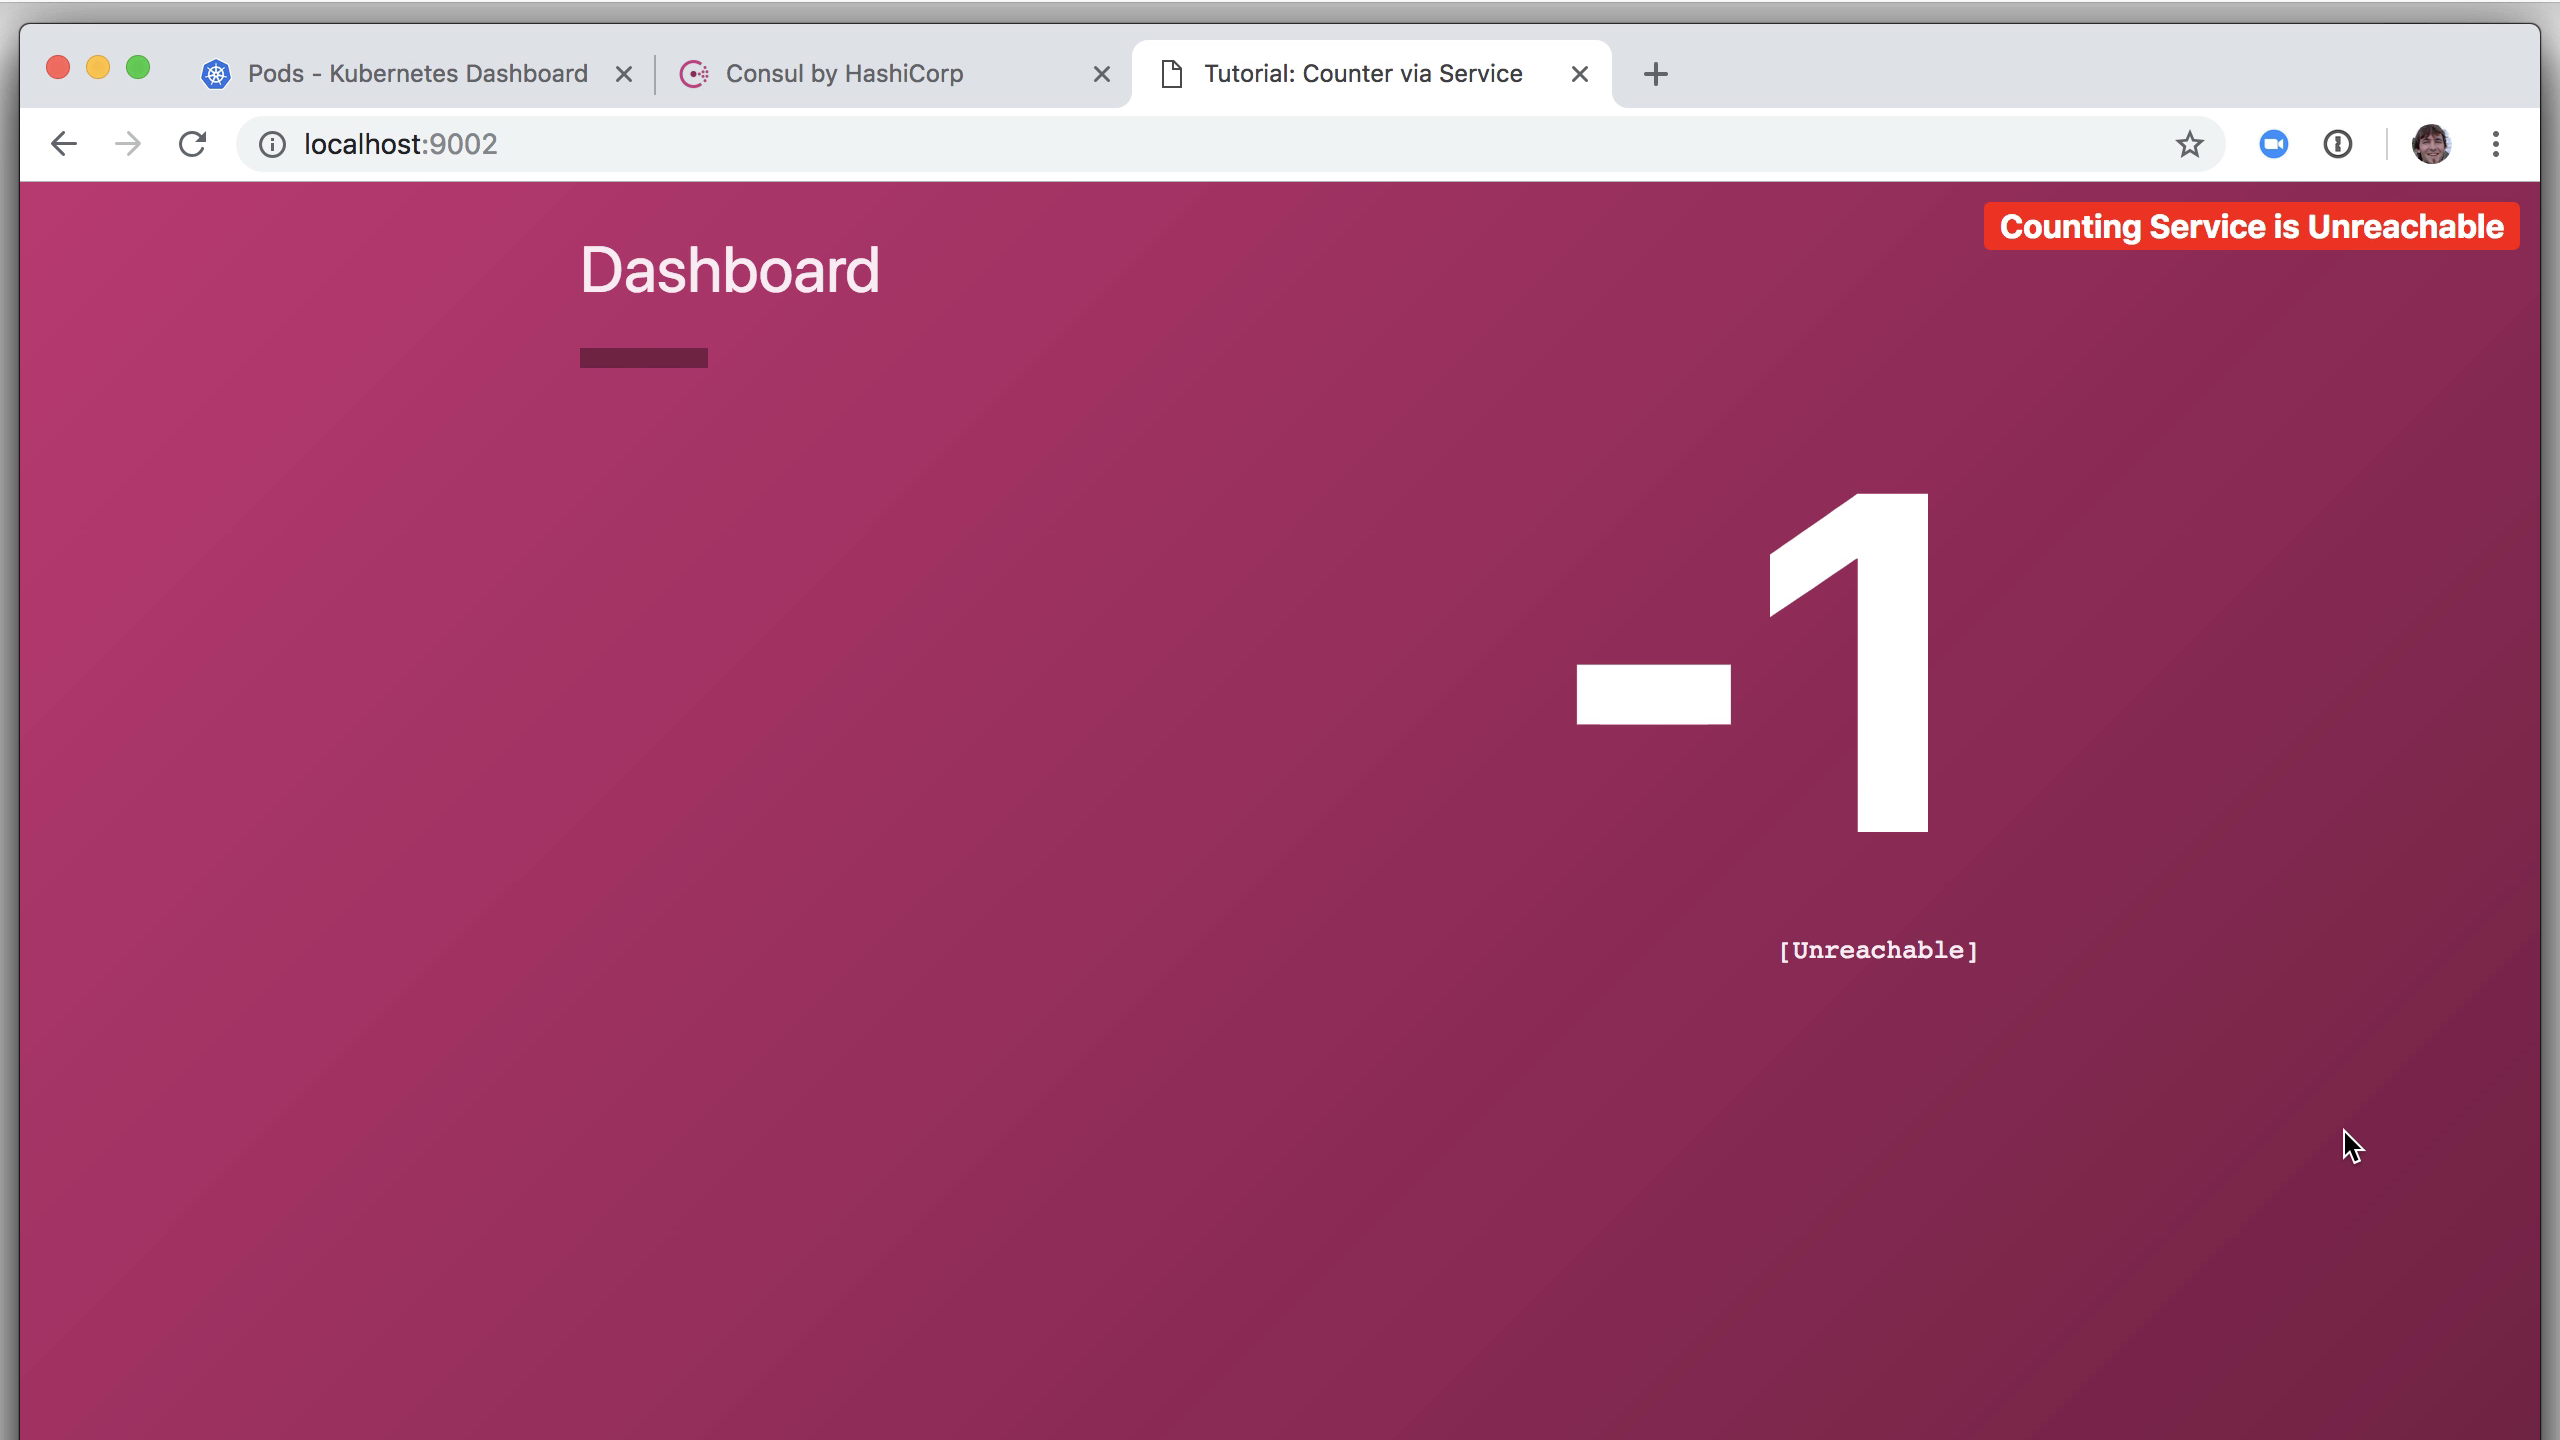
Verify this by returning to the application dashboard where you will see that the "Counting Service is Unreachable."
» Step 2: Allow the Application Dashboard to Connect to the Counting Service
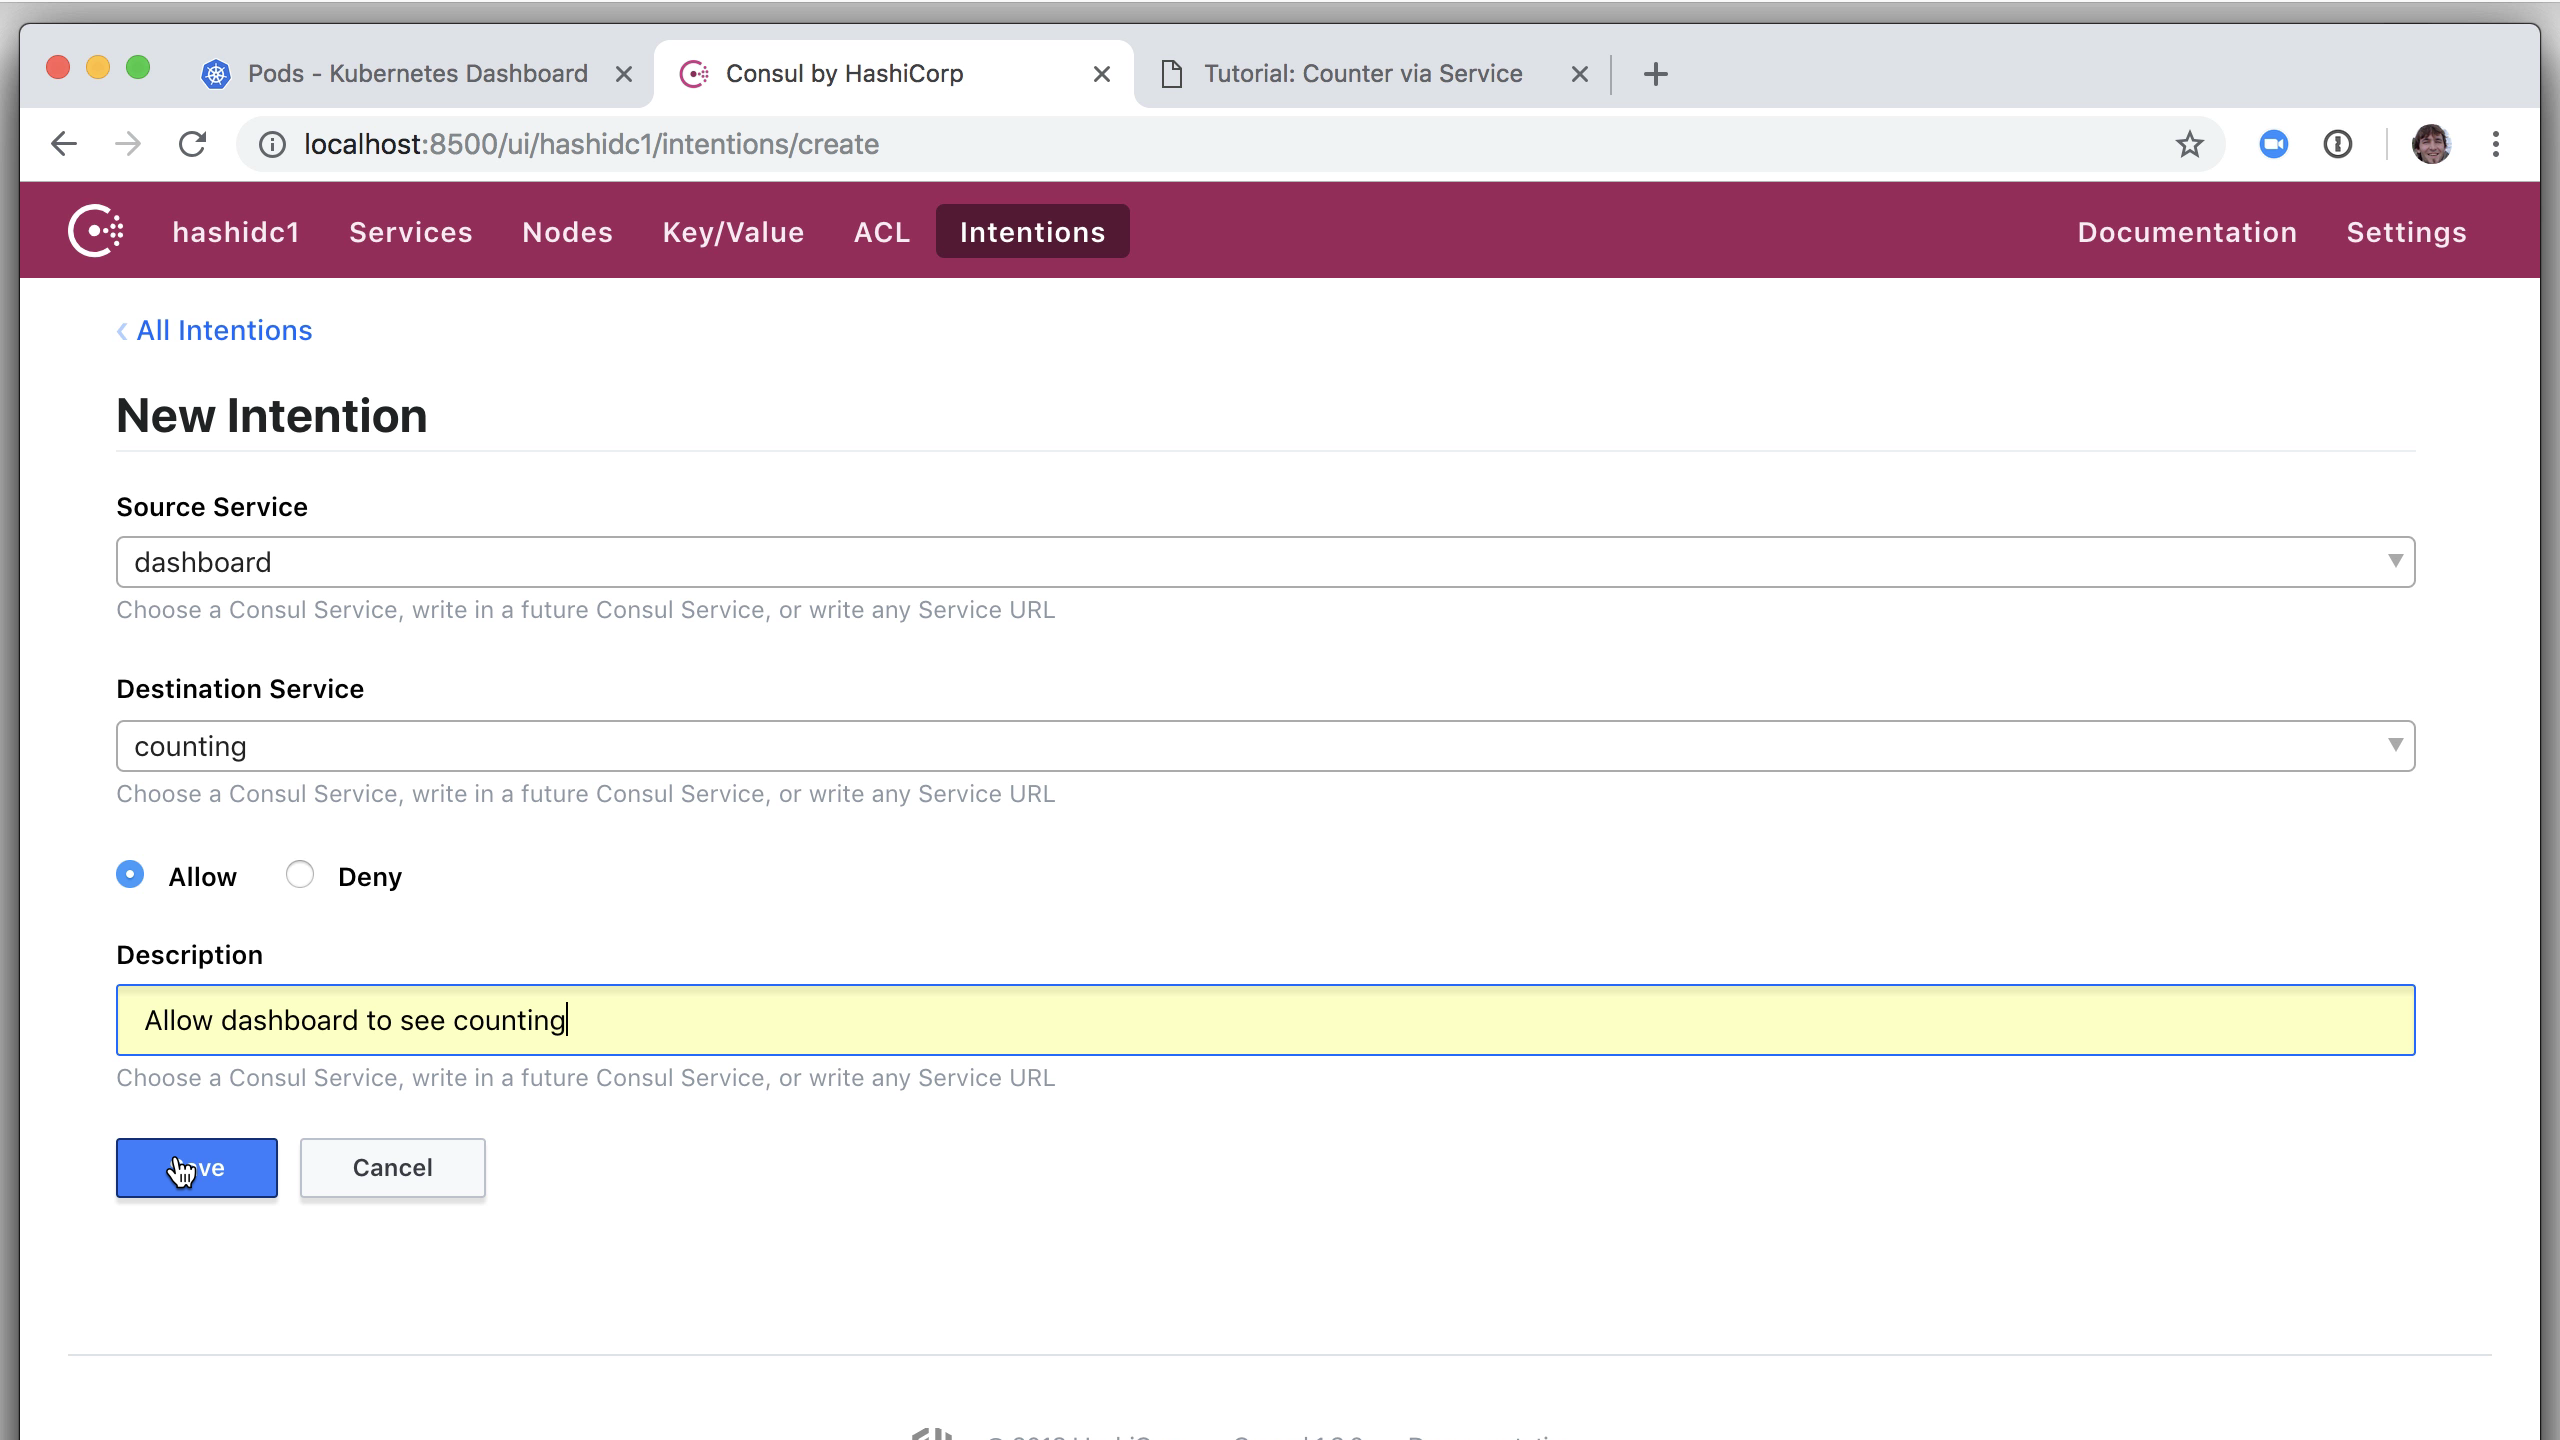
Finally, the easy part. Click the "Create" button again and create an intention that allows the dashboard source service to talk to the counting destination service. Ensure that the "Allow" radio button is selected. Optionally add a description. Click "Save."
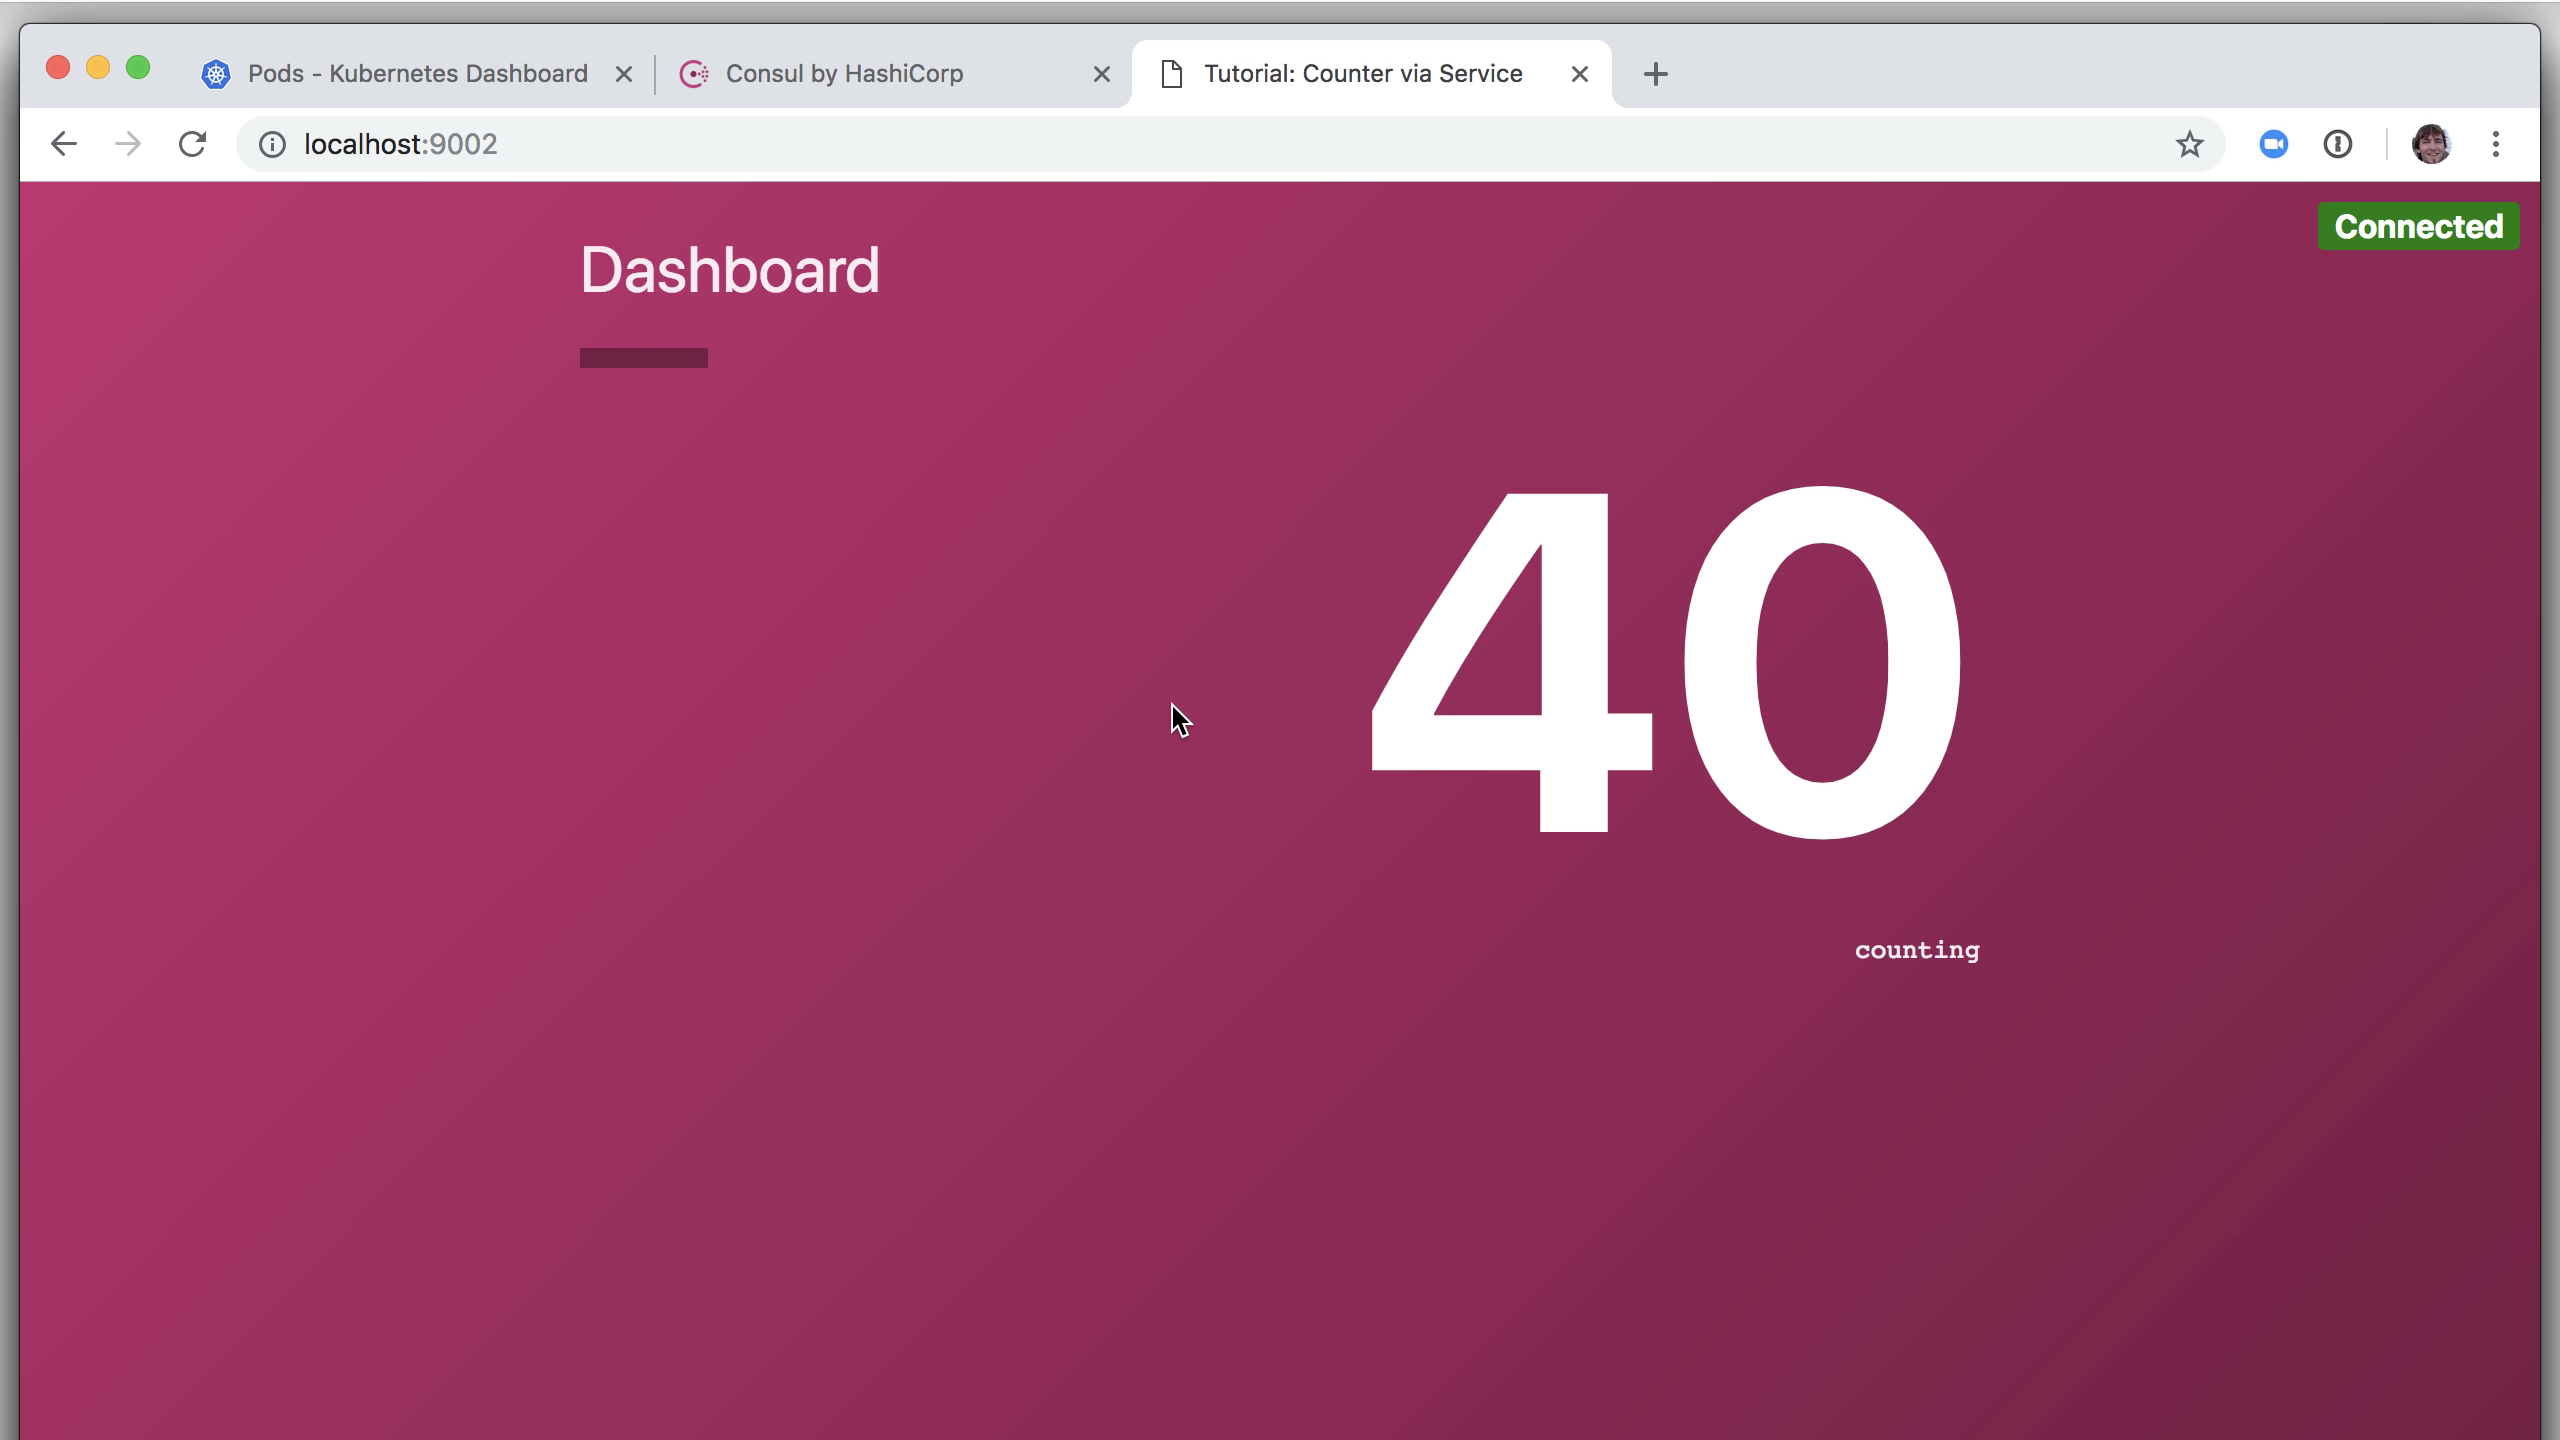
This action does not require a reboot. It takes effect so quickly that by the time you visit the application dashboard, you'll see that it's successfully communicating with the backend counting service again.
And there we have Consul running on a Kubernetes cluster, as demonstrated by two services which communicate with each other via Consul Connect and an Envoy proxy.
» Reference
For more on Consul's integration with Kubernetes (including multi-cloud, service sync, and other features), see the Consul with Kubernetes documentation.