» Monitoring Consul with Telegraf
Consul makes a range of metrics in various formats available so operators can measure the health and stability of a cluster, and diagnose or predict potential issues.
There are number of monitoring tools and options available, but for the purposes of this guide we are going to use the telegraf_plugin in conjunction with the StatsD protocol supported by Consul.
You can read the full list of metrics available with Consul in the telemetry documentation.
In this guide you will:
- Configure Telegraf to collect StatsD and host level metrics
- Configure Consul to send metrics to Telegraf
- See an example of metrics visualization
- Understand important metrics to aggregate and alert on
» Installing Telegraf
The process for installing Telegraf depends on your operating system. We recommend following the official Telegraf installation documentation.
» Configuring Telegraf
Telegraf acts as a StatsD agent and can collect additional metrics about the hosts where Consul agents are running. Telegraf itself ships with a wide range of input plugins to collect data from lots of sources for this purpose.
We're going to enable some of the most common input plugins to monitor CPU, memory, disk I/O, networking, and process status, since these are useful for debugging Consul cluster issues.
The telegraf.conf file starts with global options:
[agent]
  interval = "10s"
  flush_interval = "10s"
  omit_hostname = false
We set the default collection interval to 10 seconds and ask Telegraf to include
a host tag in each metric.
As mentioned above, Telegraf also allows you to set additional tags on the
metrics that pass through it. In this case, we are adding tags for the server
role and datacenter. We can then use these tags in Grafana to filter queries
(for example, to create a dashboard showing only servers with the
consul-server role, or only servers in the us-east-1 datacenter).
[global_tags]
  role = "consul-server"
  datacenter = "us-east-1"
Next, we set up a StatsD listener on UDP port 8125, with instructions to calculate percentile metrics and to parse DogStatsD-compatible tags, when they're sent:
[[inputs.statsd]]
  protocol = "udp"
  service_address = ":8125"
  delete_gauges = true
  delete_counters = true
  delete_sets = true
  delete_timings = true
  percentiles = [90]
  metric_separator = "_"
  parse_data_dog_tags = true
  allowed_pending_messages = 10000
  percentile_limit = 1000
The full reference to all the available StatsD-related options in Telegraf is here.
Now we can configure inputs for things like CPU, memory, network I/O, and disk
I/O. Most of them don't require any configuration, but make sure the
interfaces list in inputs.net matches the interface names you see in
ifconfig.
[[inputs.cpu]]
  percpu = true
  totalcpu = true
  collect_cpu_time = false

[[inputs.disk]]
  # mount_points = ["/"]
  # ignore_fs = ["tmpfs", "devtmpfs"]

[[inputs.diskio]]
  # devices = ["sda", "sdb"]
  # skip_serial_number = false

[[inputs.kernel]]
  # no configuration

[[inputs.linux_sysctl_fs]]
  # no configuration

[[inputs.mem]]
  # no configuration

[[inputs.net]]
  interfaces = ["enp0s*"]

[[inputs.netstat]]
  # no configuration

[[inputs.processes]]
  # no configuration

[[inputs.swap]]
  # no configuration

[[inputs.system]]
  # no configuration
Another useful plugin is the procstat plugin, which reports metrics for processes you select:
[[inputs.procstat]]
  pattern = "(consul)"
Telegraf even includes a plugin that monitors the health checks associated with the Consul agent, using Consul API to query the data.
It's important to note: the plugin itself will not report the telemetry, Consul will report those stats already using StatsD protocol.
[[inputs.consul]]
  address = "localhost:8500"
  scheme = "http"
» Telegraf Configuration for Consul
Asking Consul to send telemetry to Telegraf is as simple as adding a telemetry
section to your agent configuration:
{
  "telemetry": {
    "dogstatsd_addr": "localhost:8125",
    "disable_hostname": true
  }
}
As you can see, we only need to specify two options. The dogstatsd_addr
specifies the hostname and port of the StatsD daemon.
Note that we specify DogStatsD format instead of plain StatsD, which tells
Consul to send tags with each metric. Tags can be used by Grafana to
filter data on your dashboards (for example, displaying only the data for which
role=consul-server. Telegraf is compatible with the DogStatsD format and
allows us to add our own tags too.
The second option tells Consul not to insert the hostname in the names of the
metrics it sends to StatsD, since the hostnames will be sent as tags. Without
this option, the single metric consul.raft.apply would become multiple
metrics:
    consul.server1.raft.apply
    consul.server2.raft.apply
    consul.server3.raft.apply
If you are using a different agent (e.g. Circonus, Statsite, or plain StatsD), you may want to change this configuration, and you can find the configuration reference here.
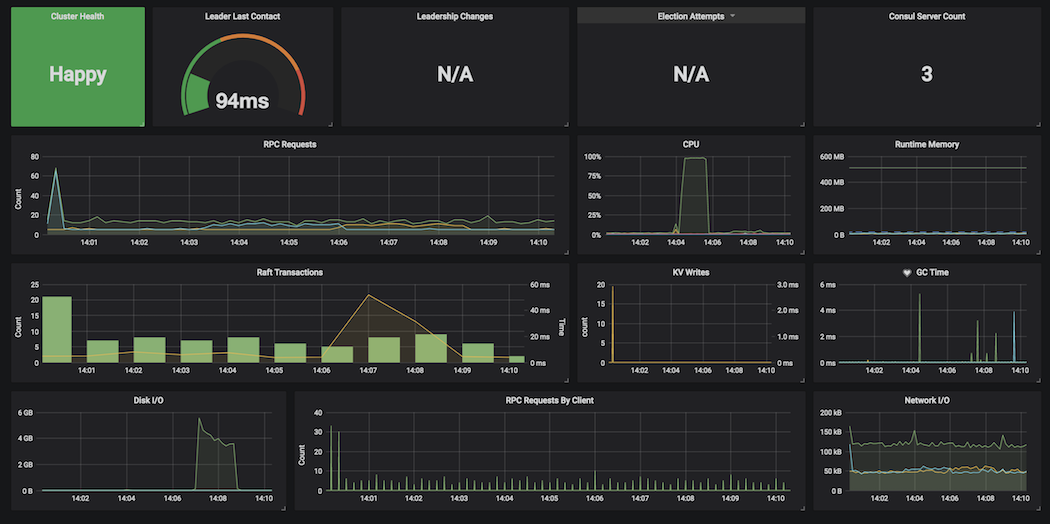
» Visualising Telegraf Consul Metrics
You can use a tool like Grafana or Chronograf to visualize metrics from Telegraf.
Here is an example Grafana dashboard:
» Metric Aggregates and Alerting from Telegraf
» Memory usage
| Metric Name | Description |
|---|---|
mem.total |
Total amount of physical memory (RAM) available on the server. |
mem.used_percent |
Percentage of physical memory in use. |
swap.used_percent |
Percentage of swap space in use. |
Why they're important: Consul keeps all of its data in memory. If Consul consumes all available memory, it will crash. You should also monitor total available RAM to make sure some RAM is available for other processes, and swap usage should remain at 0% for best performance.
What to look for: If mem.used_percent is over 90%, or if
swap.used_percent is greater than 0.
» File descriptors
| Metric Name | Description |
|---|---|
linux_sysctl_fs.file-nr |
Number of file handles being used across all processes on the host. |
linux_sysctl_fs.file-max |
Total number of available file handles. |
Why it's important: Practically anything Consul does -- receiving a connection from another host, sending data between servers, writing snapshots to disk -- requires a file descriptor handle. If Consul runs out of handles, it will stop accepting connections. See the Consul FAQ for more details.
By default, process and kernel limits are fairly conservative. You will want to increase these beyond the defaults.
What to look for: If file-nr exceeds 80% of file-max.
» CPU usage
| Metric Name | Description |
|---|---|
cpu.user_cpu |
Percentage of CPU being used by user processes (such as Consul). |
cpu.iowait_cpu |
Percentage of CPU time spent waiting for I/O tasks to complete. |
Why they're important: Consul is not particularly demanding of CPU time, but
a spike in CPU usage might indicate too many operations taking place at once,
and iowait_cpu is critical -- it means Consul is waiting for data to be
written to disk, a sign that Raft might be writing snapshots to disk too often.
What to look for: if cpu.iowait_cpu greater than 10%.
» Network activity - Bytes Recived
| Metric Name | Description |
|---|---|
net.bytes_recv |
Bytes received on each network interface. |
net.bytes_sent |
Bytes transmitted on each network interface. |
Why they're important: A sudden spike in network traffic to Consul might be the result of a misconfigured application client causing too many requests to Consul. This is the raw data from the system, rather than a specific Consul metric.
What to look for: Sudden large changes to the net metrics (greater than
50% deviation from baseline).
NOTE: The net metrics are counters, so in order to calculate rates (such
as bytes/second), you will need to apply a function such as
non_negative_difference.
» Disk activity
| Metric Name | Description |
|---|---|
diskio.read_bytes |
Bytes read from each block device. |
diskio.write_bytes |
Bytes written to each block device. |
Why they're important: If the Consul host is writing a lot of data to disk, such as under high volume workloads, there may be frequent major I/O spikes during leader elections. This is because under heavy load, Consul is checkpointing Raft snapshots to disk frequently.
It may also be caused by Consul having debug/trace logging enabled in production, which can impact performance.
Too much disk I/O can cause the rest of the system to slow down or become unavailable, as the kernel spends all its time waiting for I/O to complete.
What to look for: Sudden large changes to the diskio metrics (greater than
50% deviation from baseline, or more than 3 standard deviations from baseline).
NOTE: The diskio metrics are counters, so in order to calculate rates
(such as bytes/second), you will need to apply a function such as
non_negative_difference.
» Summary
In this guide you learned how to set up Telegraf with Consul to collect metrics, and considered your options for visualizing, aggregating, and alerting on those metrics. To learn about other factors (in addition to monitoring) that you should consider when running Consul in production, see the Production Checklist.