d3-array
Data in JavaScript is often represented by an iterable (such as an array, set or generator), and so iterable manipulation is a common task when analyzing or visualizing data. For example, you might take a contiguous slice (subset) of an array, filter an array using a predicate function, or map an array to a parallel set of values using a transform function. Before looking at the methods that d3-array provides, familiarize yourself with the powerful array methods built-in to JavaScript.
JavaScript includes mutation methods that modify the array:
- array.pop - Remove the last element from the array.
- array.push - Add one or more elements to the end of the array.
- array.reverse - Reverse the order of the elements of the array.
- array.shift - Remove the first element from the array.
- array.sort - Sort the elements of the array.
- array.splice - Add or remove elements from the array.
- array.unshift - Add one or more elements to the front of the array.
There are also access methods that return some representation of the array:
- array.concat - Join the array with other array(s) or value(s).
- array.join - Join all elements of the array into a string.
- array.slice - Extract a section of the array.
- array.indexOf - Find the first occurrence of a value within the array.
- array.lastIndexOf - Find the last occurrence of a value within the array.
And finally iteration methods that apply functions to elements in the array:
- array.filter - Create a new array with only the elements for which a predicate is true.
- array.forEach - Call a function for each element in the array.
- array.every - See if every element in the array satisfies a predicate.
- array.map - Create a new array with the result of calling a function on every element in the array.
- array.some - See if at least one element in the array satisfies a predicate.
- array.reduce - Apply a function to reduce the array to a single value (from left-to-right).
- array.reduceRight - Apply a function to reduce the array to a single value (from right-to-left).
Installing
If you use NPM, npm install d3-array. Otherwise, download the latest release. You can also load directly from d3js.org, either as a standalone library or as part of D3. AMD, CommonJS, and vanilla environments are supported. In vanilla, a d3 global is exported:
<script src="https://d3js.org/d3-array.v2.min.js"></script>
<script>

var min = d3.min(array);

</script>
API Reference
Statistics
Methods for computing basic summary statistics.
# d3.min(iterable[, accessor]) <>
Returns the minimum value in the given iterable using natural order. If the iterable contains no comparable values, returns undefined. An optional accessor function may be specified, which is equivalent to calling Array.from before computing the minimum value.
Unlike the built-in Math.min, this method ignores undefined, null and NaN values; this is useful for ignoring missing data. In addition, elements are compared using natural order rather than numeric order. For example, the minimum of the strings [“20”, “3”] is “20”, while the minimum of the numbers [20, 3] is 3.
# d3.max(iterable[, accessor]) <>
Returns the maximum value in the given iterable using natural order. If the iterable contains no comparable values, returns undefined. An optional accessor function may be specified, which is equivalent to calling Array.from before computing the maximum value.
Unlike the built-in Math.max, this method ignores undefined values; this is useful for ignoring missing data. In addition, elements are compared using natural order rather than numeric order. For example, the maximum of the strings [“20”, “3”] is “3”, while the maximum of the numbers [20, 3] is 20.
# d3.extent(iterable[, accessor]) <>
Returns the minimum and maximum value in the given iterable using natural order. If the iterable contains no comparable values, returns [undefined, undefined]. An optional accessor function may be specified, which is equivalent to calling Array.from before computing the extent.
# d3.sum(iterable[, accessor]) <>
Returns the sum of the given iterable of numbers. If the iterable contains no numbers, returns 0. An optional accessor function may be specified, which is equivalent to calling Array.from before computing the sum. This method ignores undefined and NaN values; this is useful for ignoring missing data.
# d3.mean(iterable[, accessor]) <>
Returns the mean of the given iterable of numbers. If the iterable contains no numbers, returns undefined. An optional accessor function may be specified, which is equivalent to calling Array.from before computing the mean. This method ignores undefined and NaN values; this is useful for ignoring missing data.
# d3.median(iterable[, accessor]) <>
Returns the median of the given iterable of numbers using the R-7 method. If the iterable contains no numbers, returns undefined. An optional accessor function may be specified, which is equivalent to calling Array.from before computing the median. This method ignores undefined and NaN values; this is useful for ignoring missing data.
# d3.quantile(array, p[, accessor]) <>
Returns the p-quantile of the given sorted array of numbers, where p is a number in the range [0, 1]. For example, the median can be computed using p = 0.5, the first quartile at p = 0.25, and the third quartile at p = 0.75. This particular implementation uses the R-7 method, which is the default for the R programming language and Excel. For example:
var a = [0, 10, 30];
d3.quantile(a, 0); // 0
d3.quantile(a, 0.5); // 10
d3.quantile(a, 1); // 30
d3.quantile(a, 0.25); // 5
d3.quantile(a, 0.75); // 20
d3.quantile(a, 0.1); // 2
An optional accessor function may be specified, which is equivalent to calling array.map(accessor) before computing the quantile, except that it is only called on the elements needed to compute the quantile.
# d3.variance(iterable[, accessor]) <>
Returns an unbiased estimator of the population variance of the given iterable of numbers. If the iterable has fewer than two numbers, returns undefined. An optional accessor function may be specified, which is equivalent to calling Array.from before computing the variance. This method ignores undefined and NaN values; this is useful for ignoring missing data.
# d3.deviation(iterable[, accessor]) <>
Returns the standard deviation, defined as the square root of the bias-corrected variance, of the given iterable of numbers. If the iterable has fewer than two numbers, returns undefined. An optional accessor function may be specified, which is equivalent to calling Array.from before computing the standard deviation. This method ignores undefined and NaN values; this is useful for ignoring missing data.
Search
Methods for searching arrays for a specific element.
# d3.scan(iterable[, comparator]) <>
Performs a linear scan of the specified iterable, returning the index of the least element according to the specified comparator. If the given iterable contains no comparable elements (i.e., the comparator returns NaN when comparing each element to itself), returns undefined. If comparator is not specified, it defaults to ascending. For example:
const array = [{foo: 42}, {foo: 91}];
d3.scan(array, (a, b) => a.foo - b.foo); // 0
d3.scan(array, (a, b) => b.foo - a.foo); // 1
This function is similar to min, except it allows the use of a comparator rather than an accessor and it returns the index instead of the accessed value. See also bisect.
# d3.bisectLeft(array, x[, lo[, hi]]) <>
Returns the insertion point for x in array to maintain sorted order. The arguments lo and hi may be used to specify a subset of the array which should be considered; by default the entire array is used. If x is already present in array, the insertion point will be before (to the left of) any existing entries. The return value is suitable for use as the first argument to splice assuming that array is already sorted. The returned insertion point i partitions the array into two halves so that all v < x for v in array.slice(lo, i) for the left side and all v >= x for v in array.slice(i, hi) for the right side.
# d3.bisect(array, x[, lo[, hi]]) <>
# d3.bisectRight(array, x[, lo[, hi]]) <>
Similar to bisectLeft, but returns an insertion point which comes after (to the right of) any existing entries of x in array. The returned insertion point i partitions the array into two halves so that all v <= x for v in array.slice(lo, i) for the left side and all v > x for v in array.slice(i, hi) for the right side.
# d3.bisector(accessor) <>
# d3.bisector(comparator) <>
Returns a new bisector using the specified accessor or comparator function. This method can be used to bisect arrays of objects instead of being limited to simple arrays of primitives. For example, given the following array of objects:
var data = [
  {date: new Date(2011, 1, 1), value: 0.5},
  {date: new Date(2011, 2, 1), value: 0.6},
  {date: new Date(2011, 3, 1), value: 0.7},
  {date: new Date(2011, 4, 1), value: 0.8}
];
A suitable bisect function could be constructed as:
var bisectDate = d3.bisector(function(d) { return d.date; }).right;This is equivalent to specifying a comparator:
var bisectDate = d3.bisector(function(d, x) { return d.date - x; }).right;And then applied as bisectDate(array, date), returning an index. Note that the comparator is always passed the search value x as the second argument. Use a comparator rather than an accessor if you want values to be sorted in an order different than natural order, such as in descending rather than ascending order.
# bisector.left(array, x[, lo[, hi]]) <>
Equivalent to bisectLeft, but uses this bisector’s associated comparator.
# bisector.right(array, x[, lo[, hi]]) <>
Equivalent to bisectRight, but uses this bisector’s associated comparator.
# d3.quickselect(array, k, left = 0, right = array.length - 1, compare = ascending) <>
See mourner/quickselect.
Returns -1 if a is less than b, or 1 if a is greater than b, or 0. This is the comparator function for natural order, and can be used in conjunction with the built-in array.sort method to arrange elements in ascending order. It is implemented as:
function ascending(a, b) {
  return a < b ? -1 : a > b ? 1 : a >= b ? 0 : NaN;
}
Note that if no comparator function is specified to the built-in sort method, the default order is lexicographic (alphabetical), not natural! This can lead to surprising behavior when sorting an array of numbers.
Returns -1 if a is greater than b, or 1 if a is less than b, or 0. This is the comparator function for reverse natural order, and can be used in conjunction with the built-in array sort method to arrange elements in descending order. It is implemented as:
function descending(a, b) {
  return b < a ? -1 : b > a ? 1 : b >= a ? 0 : NaN;
}
Note that if no comparator function is specified to the built-in sort method, the default order is lexicographic (alphabetical), not natural! This can lead to surprising behavior when sorting an array of numbers.
Transformations
Methods for transforming arrays and for generating new arrays.
# d3.group(iterable, ...keys) <>
Groups the specified iterable of values into a Map from key to array of value. For example, given some data:
data = [
  {name: "jim",   amount: "34.0",   date: "11/12/2015"},
  {name: "carl",  amount: "120.11", date: "11/12/2015"},
  {name: "stacy", amount: "12.01",  date: "01/04/2016"},
  {name: "stacy", amount: "34.05",  date: "01/04/2016"}
]
To group the data by name:
d3.group(data, d => d.name)This produces:
Map(3) {
  "jim" => Array(1)
  "carl" => Array(1)
  "stacy" => Array(2)
}
If more than one key is specified, a nested Map is returned. For example:
d3.group(data, d => d.name, d => d.date)This produces:
Map(3) {
  "jim" => Map(1) {
    "11/12/2015" => Array(1)
  }
  "carl" => Map(1) {
    "11/12/2015" => Array(1)
  }
  "stacy" => Map(1) {
    "01/04/2016" => Array(2)
  }
}
To convert a Map to an Array, use Array.from. For example:
Array.from(d3.group(data, d => d.name))This produces:
[
  ["jim", Array(1)],
  ["carl", Array(1)],
  ["stacy", Array(2)]
]
You can also simultaneously convert the [key, value] to some other representation by passing a map function to Array.from:
Array.from(d3.group(data, d => d.name), ([key, value]) => ({key, value}))This produces:
[
  {key: "jim", value: Array(1)},
  {key: "carl", value: Array(1)},
  {key: "stacy", value: Array(2)}
]
In the near future, selection.data will accept iterables directly, meaning that you can use a Map (or Set or other iterable) to perform a data join without first needing to convert to an array.
# d3.rollup(iterable, reduce, ...keys) <>
Groups and reduces the specified iterable of values into a Map from key to value. For example, given some data:
data = [
  {name: "jim",   amount: "34.0",   date: "11/12/2015"},
  {name: "carl",  amount: "120.11", date: "11/12/2015"},
  {name: "stacy", amount: "12.01",  date: "01/04/2016"},
  {name: "stacy", amount: "34.05",  date: "01/04/2016"}
]
To count the number of elements by name:
d3.rollup(data, v => v.length, d => d.name)This produces:
Map(3) {
  "jim" => 1
  "carl" => 1
  "stacy" => 2
}
If more than one key is specified, a nested Map is returned. For example:
d3.rollup(data, v => v.length, d => d.name, d => d.date)This produces:
Map(3) {
  "jim" => Map(1) {
    "11/12/2015" => 1
  }
  "carl" => Map(1) {
    "11/12/2015" => 1
  }
  "stacy" => Map(1) {
    "01/04/2016" => 2
  }
}
To convert a Map to an Array, use Array.from. See d3.group for examples.
# d3.cross(...iterables[, reducer]) <>
Returns the Cartesian product of the specified iterables. For example, if two iterables a and b are specified, for each element i in the iterable a and each element j in the iterable b, in order, invokes the specified reducer function passing the element i and element j. If a reducer is not specified, it defaults to a function which creates a two-element array for each pair:
function pair(a, b) {
  return [a, b];
}
For example:
d3.cross([1, 2], ["x", "y"]); // returns [[1, "x"], [1, "y"], [2, "x"], [2, "y"]]
d3.cross([1, 2], ["x", "y"], (a, b) => a + b); // returns ["1x", "1y", "2x", "2y"]Merges the specified iterable of iterables into a single array. This method is similar to the built-in array concat method; the only difference is that it is more convenient when you have an array of arrays.
d3.merge([[1], [2, 3]]); // returns [1, 2, 3]# d3.pairs(iterable[, reducer]) <>
For each adjacent pair of elements in the specified iterable, in order, invokes the specified reducer function passing the element i and element i - 1. If a reducer is not specified, it defaults to a function which creates a two-element array for each pair:
function pair(a, b) {
  return [a, b];
}
For example:
d3.pairs([1, 2, 3, 4]); // returns [[1, 2], [2, 3], [3, 4]]
d3.pairs([1, 2, 3, 4], (a, b) => b - a); // returns [1, 1, 1];
If the specified iterable has fewer than two elements, returns the empty array.
# d3.permute(array, indexes) <>
Returns a permutation of the specified array using the specified array of indexes. The returned array contains the corresponding element in array for each index in indexes, in order. For example:
permute(["a", "b", "c"], [1, 2, 0]); // returns ["b", "c", "a"]It is acceptable for the array of indexes to be a different length from the array of elements, and for indexes to be duplicated or omitted.
This method can also be used to extract the values from an object into an array with a stable order. Extracting keyed values in order can be useful for generating data arrays in nested selections. For example:
var object = {yield: 27, variety: "Manchuria", year: 1931, site: "University Farm"},
    fields = ["site", "variety", "yield"];

d3.permute(object, fields); // returns ["University Farm", "Manchuria", 27]
# d3.shuffle(array[, start[, stop]]) <>
Randomizes the order of the specified array in-place using the Fisher–Yates shuffle and returns the array. If start is specified, it is the starting index (inclusive) of the array to shuffle; if start is not specified, it defaults to zero. If stop is specified, it is the ending index (exclusive) of the array to shuffle; if stop is not specified, it defaults to array.length. For example, to shuffle the first ten elements of the array: shuffle(array, 0, 10).
# d3.ticks(start, stop, count) <>
Returns an array of approximately count + 1 uniformly-spaced, nicely-rounded values between start and stop (inclusive). Each value is a power of ten multiplied by 1, 2 or 5. See also d3.tickIncrement, d3.tickStep and linear.ticks.
Ticks are inclusive in the sense that they may include the specified start and stop values if (and only if) they are exact, nicely-rounded values consistent with the inferred step. More formally, each returned tick t satisfies start ≤ t and t ≤ stop.
# d3.tickIncrement(start, stop, count) <>
Like d3.tickStep, except requires that start is always less than or equal to step, and if the tick step for the given start, stop and count would be less than one, returns the negative inverse tick step instead. This method is always guaranteed to return an integer, and is used by d3.ticks to guarantee that the returned tick values are represented as precisely as possible in IEEE 754 floating point.
# d3.tickStep(start, stop, count) <>
Returns the difference between adjacent tick values if the same arguments were passed to d3.ticks: a nicely-rounded value that is a power of ten multiplied by 1, 2 or 5. Note that due to the limited precision of IEEE 754 floating point, the returned value may not be exact decimals; use d3-format to format numbers for human consumption.
# d3.range([start, ]stop[, step]) <>
Returns an array containing an arithmetic progression, similar to the Python built-in range. This method is often used to iterate over a sequence of uniformly-spaced numeric values, such as the indexes of an array or the ticks of a linear scale. (See also d3.ticks for nicely-rounded values.)
If step is omitted, it defaults to 1. If start is omitted, it defaults to 0. The stop value is exclusive; it is not included in the result. If step is positive, the last element is the largest start + i * step less than stop; if step is negative, the last element is the smallest start + i * step greater than stop. If the returned array would contain an infinite number of values, an empty range is returned.
The arguments are not required to be integers; however, the results are more predictable if they are. The values in the returned array are defined as start + i * step, where i is an integer from zero to one minus the total number of elements in the returned array. For example:
d3.range(0, 1, 0.2) // [0, 0.2, 0.4, 0.6000000000000001, 0.8]This unexpected behavior is due to IEEE 754 double-precision floating point, which defines 0.2 * 3 = 0.6000000000000001. Use d3-format to format numbers for human consumption with appropriate rounding; see also linear.tickFormat in d3-scale.
Likewise, if the returned array should have a specific length, consider using array.map on an integer range. For example:
d3.range(0, 1, 1 / 49); // BAD: returns 50 elements!
d3.range(49).map(function(d) { return d / 49; }); // GOOD: returns 49 elements.Uses the zip operator as a two-dimensional matrix transpose.
Returns an array of arrays, where the ith array contains the ith element from each of the argument arrays. The returned array is truncated in length to the shortest array in arrays. If arrays contains only a single array, the returned array contains one-element arrays. With no arguments, the returned array is empty.
d3.zip([1, 2], [3, 4]); // returns [[1, 3], [2, 4]]Histograms
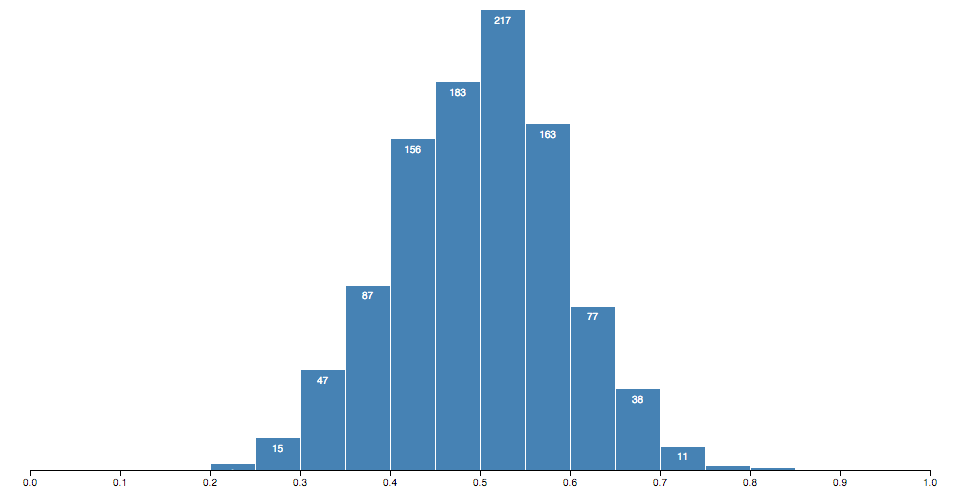
Histograms bin many discrete samples into a smaller number of consecutive, non-overlapping intervals. They are often used to visualize the distribution of numerical data.
Constructs a new histogram generator with the default settings.
Computes the histogram for the given iterable of data samples. Returns an array of bins, where each bin is an array containing the associated elements from the input data. Thus, the length of the bin is the number of elements in that bin. Each bin has two additional attributes:
x0- the lower bound of the bin (inclusive).x1- the upper bound of the bin (exclusive, except for the last bin).
If value is specified, sets the value accessor to the specified function or constant and returns this histogram generator. If value is not specified, returns the current value accessor, which defaults to the identity function.
When a histogram is generated, the value accessor will be invoked for each element in the input data array, being passed the element d, the index i, and the array data as three arguments. The default value accessor assumes that the input data are orderable (comparable), such as numbers or dates. If your data are not, then you should specify an accessor that returns the corresponding orderable value for a given datum.
This is similar to mapping your data to values before invoking the histogram generator, but has the benefit that the input data remains associated with the returned bins, thereby making it easier to access other fields of the data.
# histogram.domain([domain]) <>
If domain is specified, sets the domain accessor to the specified function or array and returns this histogram generator. If domain is not specified, returns the current domain accessor, which defaults to extent. The histogram domain is defined as an array [min, max], where min is the minimum observable value and max is the maximum observable value; both values are inclusive. Any value outside of this domain will be ignored when the histogram is generated.
For example, if you are using the the histogram in conjunction with a linear scale x, you might say:
var histogram = d3.histogram()
    .domain(x.domain())
    .thresholds(x.ticks(20));
You can then compute the bins from an array of numbers like so:
var bins = histogram(numbers);Note that the domain accessor is invoked on the materialized array of values, not on the input data array.
# histogram.thresholds([count]) <>
# histogram.thresholds([thresholds]) <>
If thresholds is specified, sets the threshold generator to the specified function or array and returns this histogram generator. If thresholds is not specified, returns the current threshold generator, which by default implements Sturges’ formula. (Thus by default, the histogram values must be numbers!) Thresholds are defined as an array of values [x0, x1, …]. Any value less than x0 will be placed in the first bin; any value greater than or equal to x0 but less than x1 will be placed in the second bin; and so on. Thus, the generated histogram will have thresholds.length + 1 bins. See histogram thresholds for more information.
Any threshold values outside the domain are ignored. The first bin.x0 is always equal to the minimum domain value, and the last bin.x1 is always equal to the maximum domain value.
If a count is specified instead of an array of thresholds, then the domain will be uniformly divided into approximately count bins; see ticks.
Histogram Thresholds
These functions are typically not used directly; instead, pass them to histogram.thresholds. You may also implement your own threshold generator taking three arguments: the array of input values derived from the data, and the observable domain represented as min and max. The generator may then return either the array of numeric thresholds or the count of bins; in the latter case the domain is divided uniformly into approximately count bins; see ticks.
# d3.thresholdFreedmanDiaconis(values, min, max) <>
Returns the number of bins according to the Freedman–Diaconis rule; the input values must be numbers.
# d3.thresholdScott(values, min, max) <>
Returns the number of bins according to Scott’s normal reference rule; the input values must be numbers.
# d3.thresholdSturges(values) <>
Returns the number of bins according to Sturges’ formula; the input values must be numbers.