You can skip having to install Elasticsearch by using our hosted Elasticsearch Service on Elastic Cloud. The Elasticsearch Service is available on both AWS and GCP. Try out the Elasticsearch Service for free.
Elasticsearch includes a bundled version of OpenJDK from the JDK maintainers (GPLv2+CE). To use your own version of Java, see the JVM version requirements
The binaries are available from www.elastic.co/downloads
along with all the releases that have been made in the past. For each release, platform
dependent archive versions are available for Windows, Linux and MacOS, as well as DEB and RPM
packages for Linux, and MSI installation packages for Windows.
Installation example on Linux
For simplicity, let’s use the tar file.
Let’s download the Elasticsearch 7.0.1 Linux tar as follows:
curl -L -O https://artifacts.elastic.co/downloads/elasticsearch/elasticsearch-7.0.1-linux-x86_64.tar.gz
Then extract it as follows:
tar -xvf elasticsearch-7.0.1-linux-x86_64.tar.gz
It will then create a bunch of files and folders in your current directory. We then go into the bin directory as follows:
cd elasticsearch-7.0.1/bin
And now we are ready to start our node and single cluster:
./elasticsearch
Installation example with MSI Windows Installer
For Windows users, we recommend using the MSI Installer package. The package contains a graphical user interface (GUI) that guides you through the installation process.
First, download the Elasticsearch 7.0.1 MSI from https://artifacts.elastic.co/downloads/elasticsearch/elasticsearch-7.0.1.msi.
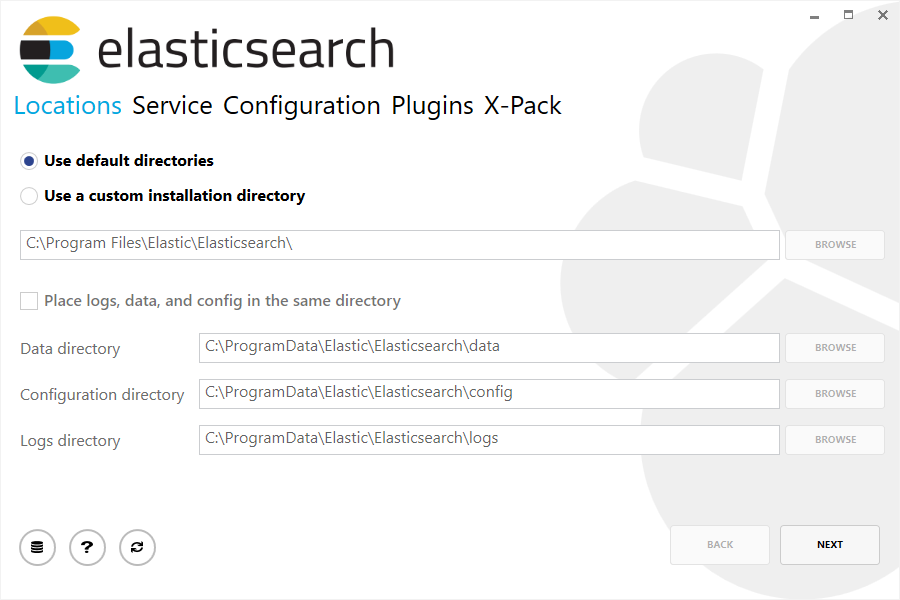
Then double-click the downloaded file to launch the GUI. Within the first screen, select the deployment directories:
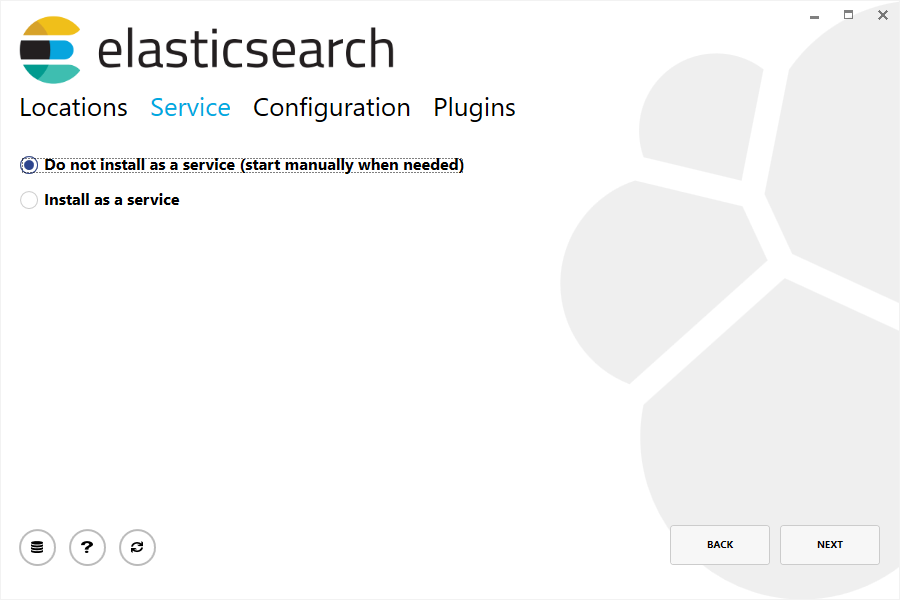
Then select whether to install as a service or start Elasticsearch manually as needed. To align with the Linux example, choose not to install as a service:
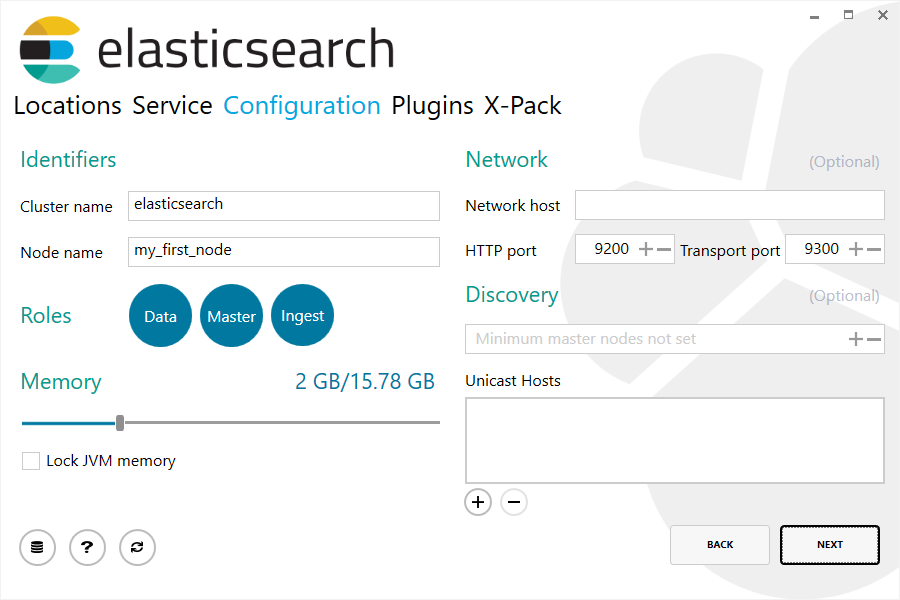
For configuration, simply leave the default values:
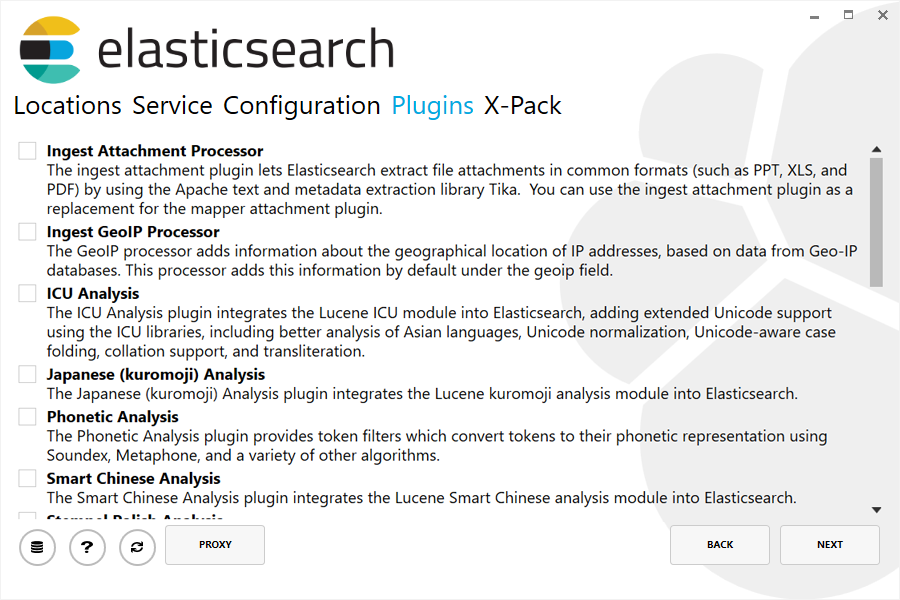
Again, to align with the tar example, uncheck all plugins to not install any plugins:
After clicking the install button, Elasticsearch will be installed:

By default, Elasticsearch will be installed at %PROGRAMFILES%\Elastic\Elasticsearch. Navigate here and go into the bin directory as follows:
with Command Prompt:
cd %PROGRAMFILES%\Elastic\Elasticsearch\bin
with PowerShell:
cd $env:PROGRAMFILES\Elastic\Elasticsearch\bin
And now we are ready to start our node and single cluster:
.\elasticsearch.exe
Successfully running node
If everything goes well with installation, you should see a bunch of messages that look like below:
[2018-09-13T12:20:01,766][INFO ][o.e.e.NodeEnvironment    ] [localhost.localdomain] using [1] data paths, mounts [[/home (/dev/mapper/fedora-home)]], net usable_space [335.3gb], net total_space [410.3gb], types [ext4]
[2018-09-13T12:20:01,772][INFO ][o.e.e.NodeEnvironment    ] [localhost.localdomain] heap size [990.7mb], compressed ordinary object pointers [true]
[2018-09-13T12:20:01,774][INFO ][o.e.n.Node               ] [localhost.localdomain] node name [localhost.localdomain], node ID [B0aEHNagTiWx7SYj-l4NTw]
[2018-09-13T12:20:01,775][INFO ][o.e.n.Node               ] [localhost.localdomain] version[7.0.1], pid[13030], build[oss/zip/77fc20e/2018-09-13T15:37:57.478402Z], OS[Linux/4.16.11-100.fc26.x86_64/amd64], JVM["Oracle Corporation"/OpenJDK 64-Bit Server VM/10/10+46]
[2018-09-13T12:20:01,775][INFO ][o.e.n.Node               ] [localhost.localdomain] JVM arguments [-Xms1g, -Xmx1g, -XX:+UseConcMarkSweepGC, -XX:CMSInitiatingOccupancyFraction=75, -XX:+UseCMSInitiatingOccupancyOnly, -XX:+AlwaysPreTouch, -Xss1m, -Djava.awt.headless=true, -Dfile.encoding=UTF-8, -Djna.nosys=true, -XX:-OmitStackTraceInFastThrow, -Dio.netty.noUnsafe=true, -Dio.netty.noKeySetOptimization=true, -Dio.netty.recycler.maxCapacityPerThread=0, -Dlog4j.shutdownHookEnabled=false, -Dlog4j2.disable.jmx=true, -Djava.io.tmpdir=/tmp/elasticsearch.LN1ctLCi, -XX:+HeapDumpOnOutOfMemoryError, -XX:HeapDumpPath=data, -XX:ErrorFile=logs/hs_err_pid%p.log, -Xlog:gc*,gc+age=trace,safepoint:file=logs/gc.log:utctime,pid,tags:filecount=32,filesize=64m, -Djava.locale.providers=COMPAT, -XX:UseAVX=2, -Dio.netty.allocator.type=unpooled, -Des.path.home=/home/manybubbles/Workspaces/Elastic/master/elasticsearch/qa/unconfigured-node-name/build/cluster/integTestCluster node0/elasticsearch-7.0.0-alpha1-SNAPSHOT, -Des.path.conf=/home/manybubbles/Workspaces/Elastic/master/elasticsearch/qa/unconfigured-node-name/build/cluster/integTestCluster node0/elasticsearch-7.0.0-alpha1-SNAPSHOT/config, -Des.distribution.flavor=oss, -Des.distribution.type=zip]
[2018-09-13T12:20:02,543][INFO ][o.e.p.PluginsService     ] [localhost.localdomain] loaded module [aggs-matrix-stats]
[2018-09-13T12:20:02,543][INFO ][o.e.p.PluginsService     ] [localhost.localdomain] loaded module [analysis-common]
[2018-09-13T12:20:02,543][INFO ][o.e.p.PluginsService     ] [localhost.localdomain] loaded module [ingest-common]
[2018-09-13T12:20:02,544][INFO ][o.e.p.PluginsService     ] [localhost.localdomain] loaded module [lang-expression]
[2018-09-13T12:20:02,544][INFO ][o.e.p.PluginsService     ] [localhost.localdomain] loaded module [lang-mustache]
[2018-09-13T12:20:02,544][INFO ][o.e.p.PluginsService     ] [localhost.localdomain] loaded module [lang-painless]
[2018-09-13T12:20:02,544][INFO ][o.e.p.PluginsService     ] [localhost.localdomain] loaded module [mapper-extras]
[2018-09-13T12:20:02,544][INFO ][o.e.p.PluginsService     ] [localhost.localdomain] loaded module [parent-join]
[2018-09-13T12:20:02,544][INFO ][o.e.p.PluginsService     ] [localhost.localdomain] loaded module [percolator]
[2018-09-13T12:20:02,544][INFO ][o.e.p.PluginsService     ] [localhost.localdomain] loaded module [rank-eval]
[2018-09-13T12:20:02,544][INFO ][o.e.p.PluginsService     ] [localhost.localdomain] loaded module [reindex]
[2018-09-13T12:20:02,545][INFO ][o.e.p.PluginsService     ] [localhost.localdomain] loaded module [repository-url]
[2018-09-13T12:20:02,545][INFO ][o.e.p.PluginsService     ] [localhost.localdomain] loaded module [transport-netty4]
[2018-09-13T12:20:02,545][INFO ][o.e.p.PluginsService     ] [localhost.localdomain] no plugins loaded
[2018-09-13T12:20:04,657][INFO ][o.e.d.DiscoveryModule    ] [localhost.localdomain] using discovery type [zen]
[2018-09-13T12:20:05,006][INFO ][o.e.n.Node               ] [localhost.localdomain] initialized
[2018-09-13T12:20:05,007][INFO ][o.e.n.Node               ] [localhost.localdomain] starting ...
[2018-09-13T12:20:05,202][INFO ][o.e.t.TransportService   ] [localhost.localdomain] publish_address {127.0.0.1:9300}, bound_addresses {[::1]:9300}, {127.0.0.1:9300}
[2018-09-13T12:20:05,221][WARN ][o.e.b.BootstrapChecks    ] [localhost.localdomain] max file descriptors [4096] for elasticsearch process is too low, increase to at least [65535]
[2018-09-13T12:20:05,221][WARN ][o.e.b.BootstrapChecks    ] [localhost.localdomain] max virtual memory areas vm.max_map_count [65530] is too low, increase to at least [262144]
[2018-09-13T12:20:08,384][INFO ][o.e.h.n.Netty4HttpServerTransport] [localhost.localdomain] publish_address {127.0.0.1:9200}, bound_addresses {[::1]:9200}, {127.0.0.1:9200}
[2018-09-13T12:20:08,384][INFO ][o.e.n.Node               ] [localhost.localdomain] started
Without going too much into detail, we can see that our node named "6-bjhwl" (which will be a different set of characters in your case) has started and elected itself as a master in a single cluster. Don’t worry yet at the moment what master means. The main thing that is important here is that we have started one node within one cluster.
As mentioned previously, we can override either the cluster or node name. This can be done from the command line when starting Elasticsearch as follows:
./elasticsearch -Ecluster.name=my_cluster_name -Enode.name=my_node_name
Also note the line marked http with information about the HTTP address (192.168.8.112) and port (9200) that our node is reachable from. By default, Elasticsearch uses port 9200 to provide access to its REST API. This port is configurable if necessary.