Version 3.0.3
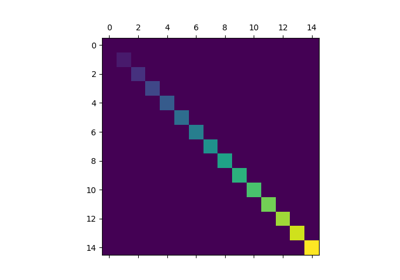
Axes.matshow(Z, **kwargs)[source]¶Plot the values of a 2D matrix or array as color-coded image.
The matrix will be shown the way it would be printed, with the first row at the top. Row and column numbering is zero-based.
| Parameters: |
|
|---|---|
| Returns: |
|
| Other Parameters: |
|
See also
imshowNotes
This is just a convenience function wrapping imshow to set useful
defaults for a displaying a matrix. In particular:
origin='upper'.interpolation='nearest'.aspect='equal'.