Version 3.0.3
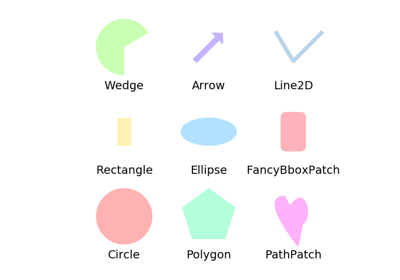
matplotlib.patches.Rectangle(xy, width, height, angle=0.0, **kwargs)[source]¶Bases: matplotlib.patches.Patch
Draw a rectangle with lower left at xy = (x, y) with specified width, height and rotation angle.
| Parameters: |
|
|---|
Notes
Valid kwargs are:
Property Description agg_filtera filter function, which takes a (m, n, 3) float array and a dpi value, and returns a (m, n, 3) array alphafloat or None animatedbool antialiasedunknown capstyle{'butt', 'round', 'projecting'} clip_boxBboxclip_onbool clip_path[( Path,Transform) |Patch| None]colorcolor containscallable edgecolorcolor or None or 'auto' facecolorcolor or None figureFigurefillbool gidstr hatch{'/', '\', '|', '-', '+', 'x', 'o', 'O', '.', '*'} in_layoutbool joinstyle{'miter', 'round', 'bevel'} labelobject linestyle{'-', '--', '-.', ':', '', (offset, on-off-seq), ...} linewidthfloat or None for default path_effectsAbstractPathEffectpickerNone or bool or float or callable rasterizedbool or None sketch_params(scale: float, length: float, randomness: float) snapbool or None transformTransformurlstr visiblebool zorderfloat
get_patch_transform()[source]¶Return the Transform instance which
takes patch coordinates to data coordinates.
For example, one may define a patch of a circle which represents a radius of 5 by providing coordinates for a unit circle, and a transform which scales the coordinates (the patch coordinate) by 5.
set_bounds(*args)[source]¶Set the bounds of the rectangle: l,b,w,h
ACCEPTS: (left, bottom, width, height)
set_xy(xy)[source]¶Set the left and bottom coords of the rectangle.
| Parameters: |
|
|---|
xy¶Return the left and bottom coords of the rectangle.