scipy.special.nctdtr
- scipy.special.nctdtr(df, nc, t) = <ufunc 'nctdtr'>
Cumulative distribution function of the non-central t distribution.
Parameters: df : array_like
Degrees of freedom of the distribution. Should be in range (0, inf).
nc : array_like
Noncentrality parameter. Should be in range (-1e6, 1e6).
t : array_like
Quantiles, i.e. the upper limit of integration.
Returns: cdf : float or ndarray
The calculated CDF. If all inputs are scalar, the return will be a float. Otherwise it will be an array.
See also
Examples
>>> from scipy import special
>>> from scipy import stats
>>> import matplotlib.pyplot as plt
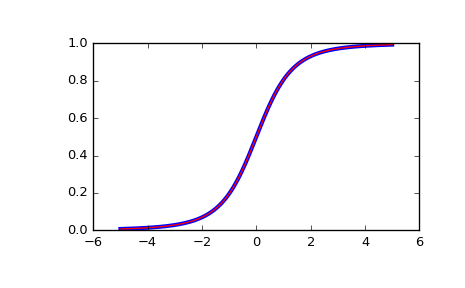
Plot the CDF of the non-central t distribution, for nc=0. Compare with the t-distribution from scipy.stats:
>>> x = np.linspace(-5, 5, num=500)
>>> df = 3
>>> nct_stats = stats.t.cdf(x, df)
>>> nct_special = special.nctdtr(df, 0, x)
>>> fig = plt.figure()
>>> ax = fig.add_subplot(111)
>>> ax.plot(x, nct_stats, 'b-', lw=3)
>>> ax.plot(x, nct_special, 'r-')
>>> plt.show()