scipy.stats.cumfreq
- scipy.stats.cumfreq(a, numbins=10, defaultreallimits=None, weights=None)[source]
Returns a cumulative frequency histogram, using the histogram function.
A cumulative histogram is a mapping that counts the cumulative number of observations in all of the bins up to the specified bin.
Parameters: a : array_like
Input array.
numbins : int, optional
The number of bins to use for the histogram. Default is 10.
defaultreallimits : tuple (lower, upper), optional
The lower and upper values for the range of the histogram. If no value is given, a range slightly larger than the range of the values in a is used. Specifically (a.min() - s, a.max() + s), where s = (1/2)(a.max() - a.min()) / (numbins - 1).
weights : array_like, optional
The weights for each value in a. Default is None, which gives each value a weight of 1.0
Returns: cumcount : ndarray
Binned values of cumulative frequency.
lowerlimit : float
Lower real limit
binsize : float
Width of each bin.
extrapoints : int
Extra points.
Examples
>>> import matplotlib.pyplot as plt
>>> from scipy import stats
>>> x = [1, 4, 2, 1, 3, 1]
>>> res = stats.cumfreq(x, numbins=4, defaultreallimits=(1.5, 5))
>>> res.cumcount
array([ 1.,  2.,  3.,  3.])
>>> res.extrapoints
3
Create a normal distribution with 1000 random values
>>> rng = np.random.RandomState(seed=12345)
>>> samples = stats.norm.rvs(size=1000, random_state=rng)
Calculate cumulative frequencies
>>> res = stats.cumfreq(samples, numbins=25)
Calculate space of values for x
>>> x = res.lowerlimit + np.linspace(0, res.binsize*res.cumcount.size,
...                                  res.cumcount.size)
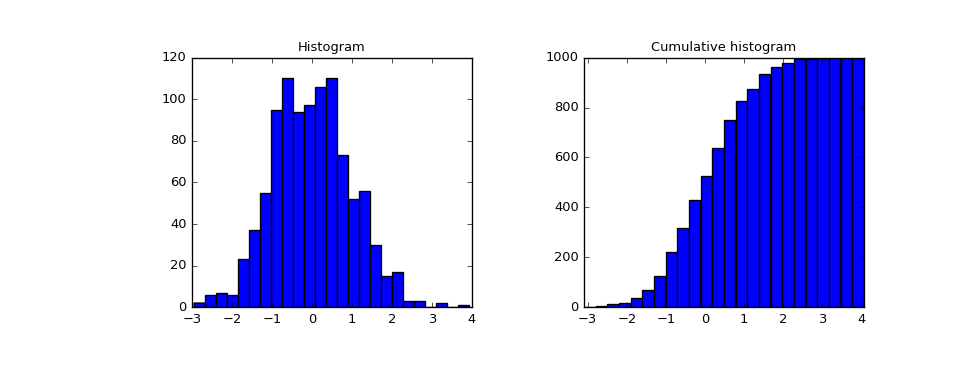
Plot histogram and cumulative histogram
>>> fig = plt.figure(figsize=(10, 4))
>>> ax1 = fig.add_subplot(1, 2, 1)
>>> ax2 = fig.add_subplot(1, 2, 2)
>>> ax1.hist(samples, bins=25)
>>> ax1.set_title('Histogram')
>>> ax2.bar(x, res.cumcount, width=res.binsize)
>>> ax2.set_title('Cumulative histogram')
>>> ax2.set_xlim([x.min(), x.max()])
>>> plt.show()