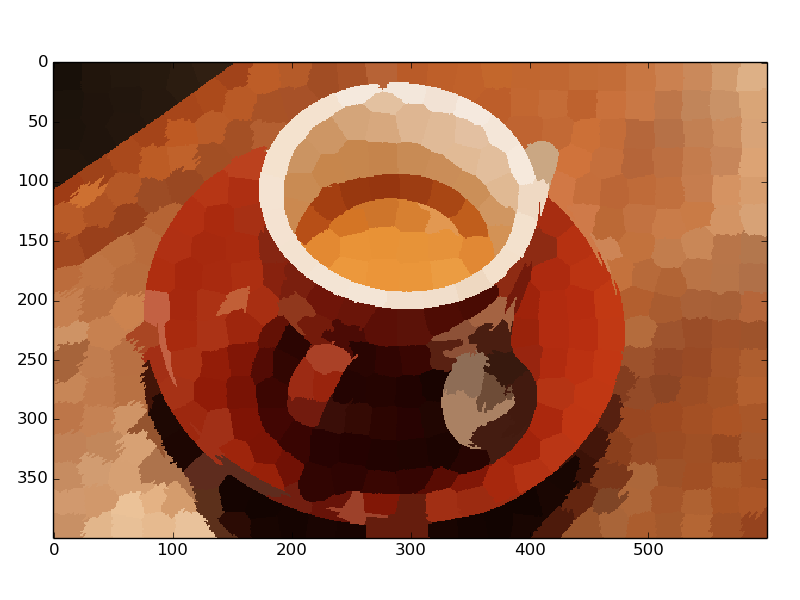
This example constructs a Region Adjacency Graph (RAG) and recursively performs a Normalized Cut on it.
| [1] | Shi, J.; Malik, J., “Normalized cuts and image segmentation”, Pattern Analysis and Machine Intelligence, IEEE Transactions on, vol. 22, no. 8, pp. 888-905, August 2000. |
from skimage import data, io, segmentation, color
from skimage.future import graph
from matplotlib import pyplot as plt


img = data.coffee()

labels1 = segmentation.slic(img, compactness=30, n_segments=400)
out1 = color.label2rgb(labels1, img, kind='avg')

g = graph.rag_mean_color(img, labels1, mode='similarity')
labels2 = graph.cut_normalized(labels1, g)
out2 = color.label2rgb(labels2, img, kind='avg')

plt.figure()
io.imshow(out1)
plt.figure()
io.imshow(out2)
io.show()
Python source code: download
(generated using skimage 0.12.3)
IPython Notebook: download
(generated using skimage 0.12.3)
 Source