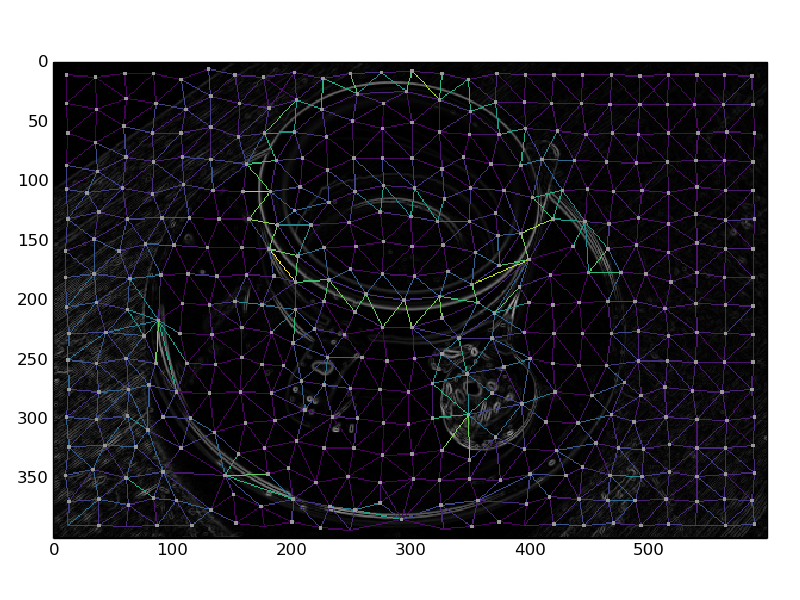
This example demonstrates construction of region boundary based RAGs with the rag_boundary function.
from skimage.future import graph
from skimage import data, segmentation, color, filters, io
from skimage.util.colormap import viridis


img = data.coffee()
gimg = color.rgb2gray(img)

labels = segmentation.slic(img, compactness=30, n_segments=400)
edges = filters.sobel(gimg)
edges_rgb = color.gray2rgb(edges)

g = graph.rag_boundary(labels, edges)

out = graph.draw_rag(labels, g, edges_rgb, node_color="#999999",
                     colormap=viridis)

io.imshow(out)
io.show()
Python source code: download
(generated using skimage 0.12.3)
IPython Notebook: download
(generated using skimage 0.12.3)
 Source