
Note
Click here to download the full example code
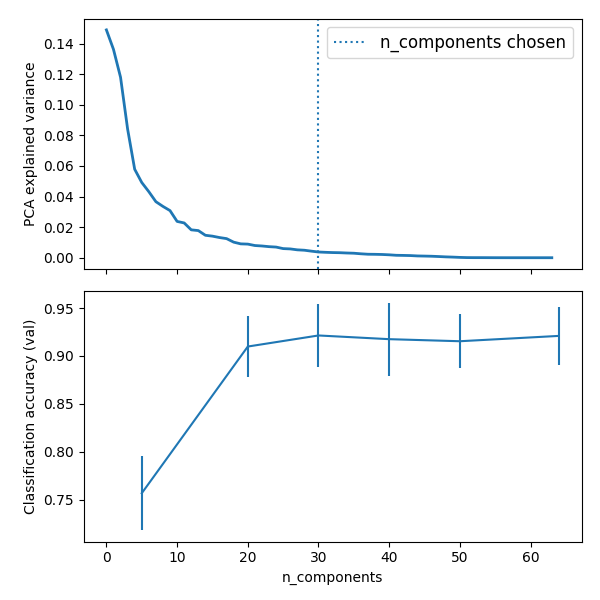
Pipelining: chaining a PCA and a logistic regression
The PCA does an unsupervised dimensionality reduction, while the logistic regression does the prediction.
We use a GridSearchCV to set the dimensionality of the PCA
Out:
Best parameter (CV score=0.921):
{'logistic__alpha': 0.01, 'pca__n_components': 30}
print(__doc__)


# Code source: Gaël Varoquaux
# Modified for documentation by Jaques Grobler
# License: BSD 3 clause


import numpy as np
import matplotlib.pyplot as plt
import pandas as pd

from sklearn import datasets
from sklearn.decomposition import PCA
from sklearn.linear_model import SGDClassifier
from sklearn.pipeline import Pipeline
from sklearn.model_selection import GridSearchCV


# Define a pipeline to search for the best combination of PCA truncation
# and classifier regularization.
logistic = SGDClassifier(loss='log', penalty='l2', early_stopping=True,
                         max_iter=10000, tol=1e-5, random_state=0)
pca = PCA()
pipe = Pipeline(steps=[('pca', pca), ('logistic', logistic)])

digits = datasets.load_digits()
X_digits = digits.data
y_digits = digits.target

# Parameters of pipelines can be set using ‘__’ separated parameter names:
param_grid = {
    'pca__n_components': [5, 20, 30, 40, 50, 64],
    'logistic__alpha': np.logspace(-4, 4, 5),
}
search = GridSearchCV(pipe, param_grid, iid=False, cv=5,
                      return_train_score=False)
search.fit(X_digits, y_digits)
print("Best parameter (CV score=%0.3f):" % search.best_score_)
print(search.best_params_)

# Plot the PCA spectrum
pca.fit(X_digits)

fig, (ax0, ax1) = plt.subplots(nrows=2, sharex=True, figsize=(6, 6))
ax0.plot(pca.explained_variance_ratio_, linewidth=2)
ax0.set_ylabel('PCA explained variance')

ax0.axvline(search.best_estimator_.named_steps['pca'].n_components,
            linestyle=':', label='n_components chosen')
ax0.legend(prop=dict(size=12))

# For each number of components, find the best classifier results
results = pd.DataFrame(search.cv_results_)
components_col = 'param_pca__n_components'
best_clfs = results.groupby(components_col).apply(
    lambda g: g.nlargest(1, 'mean_test_score'))

best_clfs.plot(x=components_col, y='mean_test_score', yerr='std_test_score',
               legend=False, ax=ax1)
ax1.set_ylabel('Classification accuracy (val)')
ax1.set_xlabel('n_components')

plt.tight_layout()
plt.show()
Total running time of the script: ( 0 minutes 24.298 seconds)