
Note
Click here to download the full example code
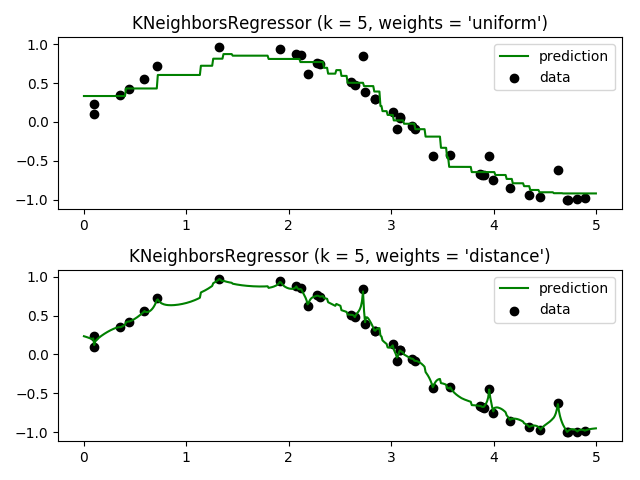
Nearest Neighbors regression
Demonstrate the resolution of a regression problem using a k-Nearest Neighbor and the interpolation of the target using both barycenter and constant weights.
print(__doc__)

# Author: Alexandre Gramfort <alexandre.gramfort@inria.fr>
#         Fabian Pedregosa <fabian.pedregosa@inria.fr>
#
# License: BSD 3 clause (C) INRIA


# #############################################################################
# Generate sample data
import numpy as np
import matplotlib.pyplot as plt
from sklearn import neighbors

np.random.seed(0)
X = np.sort(5 * np.random.rand(40, 1), axis=0)
T = np.linspace(0, 5, 500)[:, np.newaxis]
y = np.sin(X).ravel()

# Add noise to targets
y[::5] += 1 * (0.5 - np.random.rand(8))

# #############################################################################
# Fit regression model
n_neighbors = 5

for i, weights in enumerate(['uniform', 'distance']):
    knn = neighbors.KNeighborsRegressor(n_neighbors, weights=weights)
    y_ = knn.fit(X, y).predict(T)

    plt.subplot(2, 1, i + 1)
    plt.scatter(X, y, c='k', label='data')
    plt.plot(T, y_, c='g', label='prediction')
    plt.axis('tight')
    plt.legend()
    plt.title("KNeighborsRegressor (k = %i, weights = '%s')" % (n_neighbors,
                                                                weights))

plt.tight_layout()
plt.show()
Total running time of the script: ( 0 minutes 0.159 seconds)