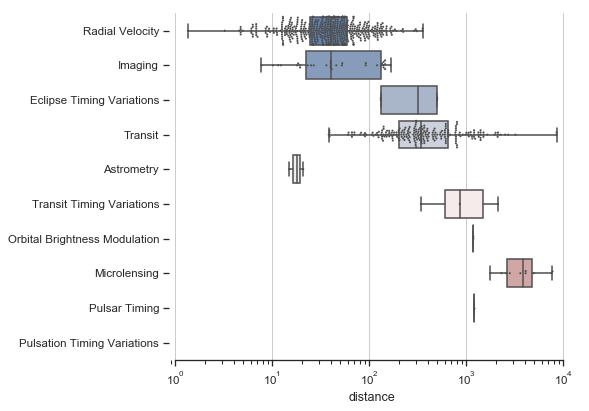
Horizontal boxplot with observations
Python source code: [download source: horizontal_boxplot.py]
import seaborn as sns
import matplotlib.pyplot as plt

sns.set(style="ticks")

# Initialize the figure with a logarithmic x axis
f, ax = plt.subplots(figsize=(7, 6))
ax.set_xscale("log")

# Load the example planets dataset
planets = sns.load_dataset("planets")

# Plot the orbital period with horizontal boxes
sns.boxplot(x="distance", y="method", data=planets,
            whis="range", palette="vlag")

# Add in points to show each observation
sns.swarmplot(x="distance", y="method", data=planets,
              size=2, color=".3", linewidth=0)

# Tweak the visual presentation
ax.xaxis.grid(True)
ax.set(ylabel="")
sns.despine(trim=True, left=True)