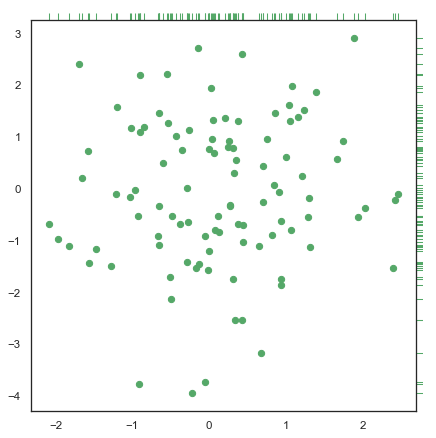
Scatterplot with marginal ticks
Python source code: [download source: marginal_ticks.py]
import numpy as np
import seaborn as sns
import matplotlib.pyplot as plt
sns.set(style="white", color_codes=True)

# Generate a random bivariate dataset
rs = np.random.RandomState(9)
mean = [0, 0]
cov = [(1, 0), (0, 2)]
x, y = rs.multivariate_normal(mean, cov, 100).T

# Use JointGrid directly to draw a custom plot
grid = sns.JointGrid(x, y, space=0, height=6, ratio=50)
grid.plot_joint(plt.scatter, color="g")
grid.plot_marginals(sns.rugplot, height=1, color="g")