Running the Project
From Xojo Documentation
Contents
While working on your project, you are going to want to test it to make sure it works like you expect. You can do this by clicking the Run button on the toolbar, selecting Project ↠ Run from the menu or pressing ⌘-R (Ctrl-R on Windows and Linux). When you run your project like this, you are running it in debug mode. In this mode, Xojo is communicating in the background with your app. In the Workspace, a separate tab (containing the debugger) appears with the name of your app.
When this tab is selected, the Debugger displays. In this tab, the Navigator displays the Run section and the name of the app being debugged.
When this tab is selected, the Debugger displays. In this tab, the Navigator displays the Run section and the name of the app being debugged.
To learn more about Debugging, also read the Debugging and Profiling section.
Debugger
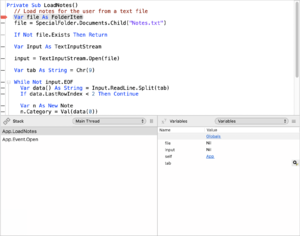
The debugger can be used to watch how your app runs. It is divided into three main areas:
- Stack
- Displays the order that the code in your application was called.
- Variables
- Displays variables and their current values.
- Source Code
- Displays the source code that is currently running with the current line highlighted when the debugger is paused.
To see the Stack, Variables and currently running source code, you can set a breakpoint in your source code or you can click the pause button on the toolbar.
Command Bar
The debugger Command Bar has these commands:
- Pause
- Pauses the app at the currently running line of code. The debugger will display the line of code highlighted in gray.
- Stop
- Stops the running app, closing the debugger.
- Step
- When Paused, steps through the code one line at a time.
- Step In
- When Paused, if the current line of code is a method then this action steps you into the first line of code in the method.
- Step Out
- When Paused, if you are within a method, this action runs the rest of the code in the method and pauses debugging at the line of code after the method call.
- View Source
- Takes you to the project item and displays the source code so that you can edit it. Changes you make to the code do not take affect until you run the project again.
Using the Debugger
You have three ways to Pause the debugger so you can review running code:
- Use the Pause button, which does not allow you to control where the code will pause.
- Set a breakpoint in your code.
- Use the Break command in your code.
Once you are in the debugger, you can view the source code but not make any changes to it. To edit code, use the View Source button to find the code in the project to edit. Any changes you make do not take affect until you run the project again.
To resume running your app after it has paused, click the Resume button on the toolbar, which appears in place of the Run button. You can also completely stop the running app by clicking the Stop button on the toolbar. This does not take you to the debugger since the app has been terminated, but it can be useful if you need to quickly stop the app because of an infinite loop or some other programming error.
Stack
The Stack area (lower left corner) displays the name of the objects in the order they were called with the current object at the top of the list. You can click on other items in the list to view the code that previously ran.
The PopupMenu in the Stack area usually just displays “Main Thread”. If you are specifically using Threading, you can use this popup to look at code that is running in other threads.
Variables
The Variables area (lower right corner) displays the variables that are local to the currently running method. The left column displays variable names and the right displays their values. You can click on values on the right side to display them in more detail. Some values (such as numbers and strings) can have their values edited so that you can affect the outcome of subsequent code.
As you click to view details of variables, the PopupMenu in the Variables section changes to display what is being viewed. You can use this popup to go back to the prior variables.
In addition, the “Globals” item in the Variables section will let you review global values in the app, such as modules and the contents of the App object.
Setting Breakpoints
In the Code Editor, the gutter in the left margin shows horizontal dashes for lines of code that can have their breakpoint set. To set the breakpoint, just click on the dash. This causes a red dot to appear indicating that a breakpoint is set. To turn off the breakpoint, click on the red circle. You can also set breakpoints using Project ↠ Breakpoint ↠ Turn on (⌘+\ on macOS, Ctrl-\ on Windows and Linux).
To disable all the breakpoints in your app, use Project ↠ Breakpoint ↠ Clear All. To view all the breakpoints in your project, choose Project ↠ Breakpoint ↠ Show All, which displays the breakpoints in the Find panel.
You can also use the Break command to cause your application to pause. When your code reaches a Break command, the debugger pauses at that line. In a standalone app, the Break command is ignored. You can use the Break command to conditionally pause your app and activate the debugger based on specific situations.
For example, if your app is in a loop, you may only want to break into the debugger when a certain value is reached:
See Also
Break command; DebugBuild constant
UserGuide:Code Editor, UserGuide:Debugging Overview, UserGuide:Debugger Usage topics


