Navigation

- Home |
- Gallery |
- API Docs »
- wx.lib »
- wx.lib.plot »
- wx.lib.plot.plotcanvas »
- wx.lib.plot.plotcanvas.PlotCanvas
- index
- modules |
- next |
- previous |

 wx.lib.plot.plotcanvas.PlotCanvas
Creates a PlotCanvas object.
Subclass of a wx.Panel which holds two scrollbars and the actual plotting canvas (self.canvas). It allows for simple general plotting of data with zoom, labels, and automatic axis scaling.
This is the main window that you will want to import into your application.
Parameters for __init__ are the same as any wx.Panel.
 Methods Summary
__init__ |
|
Clear |
Erase the window. |
Draw |
Wrapper around _Draw, which handles log axes |
GetClosestPoint |
Returns list with |
GetClosestPoints |
Returns list with |
GetEnableAntiAliasing |
Get the enableAntiAliasing value. |
GetEnableCenterLines |
Get the enableCenterLines value. |
GetEnableDiagonals |
Get the enableDiagonals value. |
GetEnableDrag |
Get the enableDrag value. |
GetEnableGrid |
Get the enableGrid value. |
GetEnableHiRes |
Get the enableHiRes value. |
GetEnableLegend |
Get the enableLegend value. |
GetEnablePointLabel |
Set the enablePointLabel value. |
GetEnableTitle |
Get the enableTitle value. |
GetEnableZoom |
Get the enableZoom value. |
GetFontSizeAxis |
Get current tick and axis label font size in points |
GetFontSizeLegend |
Get legend font size (default is 7 point) |
GetFontSizeTitle |
Get Title font size (default is 15 point) |
getLogScale |
Set the log scale boolean value. |
GetPointLabelFunc |
Get the enablePointLabel value. |
GetShowScrollbars |
Get the showScrollbars value. |
GetUseScientificNotation |
Get the useScientificNotation value. |
GetXCurrentRange |
Get the xCurrentRange value. |
GetXMaxRange |
Get the xMaxRange value. |
GetXSpec |
Get the xSpec value. |
GetXY |
Wrapper around _getXY, which handles log scales |
GetYCurrentRange |
Get the yCurrentRange value. |
GetYMaxRange |
Get the yMaxRange value. |
GetYSpec |
Get the ySpec value. |
OnLeave |
Used to erase pointLabel when mouse outside window |
OnMotion |
|
OnMouseDoubleClick |
|
OnMouseLeftDown |
|
OnMouseLeftUp |
|
OnMouseRightDown |
|
OnPaint |
|
OnScroll |
|
OnSize |
|
PageSetup |
Brings up the page setup dialog |
PositionScreenToUser |
Converts Screen position to User Coordinates |
PositionUserToScreen |
Converts User position to Screen Coordinates |
Printout |
Print current plot. |
PrintPreview |
Print-preview current plot. |
Redraw |
Redraw the existing plot. |
Reset |
Unzoom the plot. |
SaveFile |
Saves the file to the type specified in the extension. If no file |
ScrollRight |
Move view right number of axis units. |
ScrollUp |
Move view up number of axis units. |
SetCursor |
|
SetEnableAntiAliasing |
Set the enableAntiAliasing value. |
SetEnableCenterLines |
Set the enableCenterLines value. |
SetEnableDiagonals |
Set the enableDiagonals value. |
SetEnableDrag |
Set the enableDrag value. |
SetEnableGrid |
Set the enableGrid value. |
SetEnableHiRes |
Set the enableHiRes value. |
SetEnableLegend |
Set the enableLegend value. |
SetEnablePointLabel |
Set the enablePointLabel value. |
SetEnableTitle |
Set the enableTitle value. |
SetEnableZoom |
Set the enableZoom value. |
SetFontSizeAxis |
Set the tick and axis label font size (default is 10 point) |
SetFontSizeLegend |
Set legend font size (default is 7 point) |
SetFontSizeTitle |
Set Title font size (default is 15 point) |
setLogScale |
Set the log scale boolean value. |
SetPointLabelFunc |
Set the enablePointLabel value. |
SetShowScrollbars |
Set the showScrollbars value. |
SetUseScientificNotation |
Set the useScientificNotation value. |
SetXSpec |
Set the xSpec value. |
SetYSpec |
Set the ySpec value. |
UpdatePointLabel |
Updates the pointLabel point on screen with data contained in |
Zoom |
Zoom on the plot |
 Properties Summary
absScale |
The absScale value as a 2-tuple of bools |
axesPen |
The wx.Pen used to draw the axes lines on the plot. |
centerLinePen |
The wx.Pen used to draw the center lines on the plot. |
diagonalPen |
The wx.Pen used to draw the diagonal lines on the plot. |
enableAntiAliasing |
The current enableAntiAliasing value. |
enableAxes |
The current enableAxes value. |
enableAxesLabels |
The current enableAxesLabels value. |
enableAxesValues |
The current enableAxesValues value. |
enableCenterLines |
The current enableCenterLines value. |
enableDiagonals |
The current enableDiagonals value. |
enableDrag |
The current enableDrag value. |
enableGrid |
The current enableGrid value. |
enableHiRes |
The current enableHiRes value. |
enableLegend |
The current enableLegend value. |
enablePlotTitle |
The current enablePlotTitle value. |
enablePointLabel |
The current enablePointLabel value. |
enableTicks |
The current enableTicks value. |
enableTitle |
The current enableTitle value. |
enableXAxisLabel |
The current enableXAxisLabel value. |
enableYAxisLabel |
The current enableYAxisLabel value. |
enableZoom |
The current enableZoom value. |
fontSizeAxis |
The current tick and axis label font size in points. |
fontSizeLegend |
The current Legned font size in points. |
fontSizeTitle |
The current Title font size in points. |
gridPen |
The wx.Pen used to draw the grid lines on the plot. |
logScale |
The logScale value as a 2-tuple of bools |
pageSetupData |
|
pointLabelFunc |
The current pointLabelFunc value. |
print_data |
|
showScrollbars |
The current showScrollbars value. |
tickLength |
The length of the tick marks on an axis. |
tickLengthPrinterScale |
|
tickPen |
The wx.Pen used to draw the tick marks on the plot. |
useScientificNotation |
The current useScientificNotation value. |
xCurrentRange |
The plots’ X range of the currently displayed portion as |
xMaxRange |
The plots’ maximum X range as a tuple of (min, max). |
xSpec |
Defines the X axis type. |
yCurrentRange |
The plots’ Y range of the currently displayed portion as |
yMaxRange |
The plots’ maximum Y range as a tuple of (min, max). |
ySpec |
Defines the Y axis type. |
 Class API
PlotCanvas(wx.Panel)¶Creates a PlotCanvas object.
Subclass of a wx.Panel which holds two scrollbars and the actual plotting canvas (self.canvas). It allows for simple general plotting of data with zoom, labels, and automatic axis scaling.
This is the main window that you will want to import into your application.
Parameters for __init__ are the same as any wx.Panel.
__init__(self, parent, id=wx.ID_ANY, pos=wx.DefaultPosition, size=wx.DefaultSize, style=0, name="plotCanvas")¶Clear(self)¶Erase the window.
Draw(self, graphics, xAxis=None, yAxis=None, dc=None)¶Wrapper around _Draw, which handles log axes
GetClosestPoint(self, pntXY, pointScaled=True)¶Returns list with [curveNumber, legend, index of closest point, pointXY, scaledXY, distance] list for only the closest curve. Returns [] if no curves are being plotted.
x, y in user coords
if pointScaled == True based on screen coords
if pointScaled == False based on user coords
GetClosestPoints(self, pntXY, pointScaled=True)¶Returns list with [curveNumber, legend, index of closest point, pointXY, scaledXY, distance] list for each curve. Returns [] if no curves are being plotted.
x, y in user coords
if pointScaled == True based on screen coords
if pointScaled == False based on user coords
GetEnableAntiAliasing(self)¶Get the enableAntiAliasing value.
Deprecated since version Feb: 27, 2016
Use the
enableAntiAliasing
property instead.
GetEnableCenterLines(self)¶Get the enableCenterLines value.
Deprecated since version Feb: 27, 2016
Use the enableCenterLines
property instead.
GetEnableDiagonals(self)¶Get the enableDiagonals value.
Deprecated since version Feb: 27, 2016
Use the enableDiagonals
property instead.
GetEnableDrag(self)¶Get the enableDrag value.
Deprecated since version Feb: 27, 2016
Use the enableDrag
property instead.
GetEnableGrid(self)¶Get the enableGrid value.
Deprecated since version Feb: 27, 2016
Use the enableGrid
property instead.
GetEnableHiRes(self)¶Get the enableHiRes value.
Deprecated since version Feb: 27, 2016
Use the enableHiRes
property instead.
GetEnableLegend(self)¶Get the enableLegend value.
Deprecated since version Feb: 27, 2016
Use the enableLegend
property instead.
GetEnablePointLabel(self)¶Set the enablePointLabel value.
Deprecated since version Feb: 27, 2016
Use the enablePointLabel
property instead.
GetEnableTitle(self)¶Get the enableTitle value.
Deprecated since version Feb: 27, 2016
Use the enableTitle
property instead.
GetEnableZoom(self)¶Get the enableZoom value.
Deprecated since version Feb: 27, 2016
Use the enableZoom
property instead.
GetFontSizeAxis(self)¶Get current tick and axis label font size in points
Deprecated since version Feb: 27, 2016
Use the fontSizeAxis
property
instead.
GetFontSizeLegend(self)¶Get legend font size (default is 7 point)
Deprecated since version Feb: 27, 2016
Use the :attr:`~wx.lib.plot.plotcanvas.PlotCanvas.fontSizeLegend’ property instead.
GetFontSizeTitle(self)¶Get Title font size (default is 15 point)
Deprecated since version Feb: 27, 2016
Use the fontSizeTitle
property instead.
getLogScale(self)¶Set the log scale boolean value.
Deprecated since version Feb: 27, 2016
Use the logScale
property instead.
GetPointLabelFunc(self)¶Get the enablePointLabel value.
Deprecated since version Feb: 27, 2016
Use the enablePointLabel
property instead.
GetShowScrollbars(self)¶Get the showScrollbars value.
Deprecated since version Feb: 27, 2016
Use the showScrollbars
property instead.
GetUseScientificNotation(self)¶Get the useScientificNotation value.
Deprecated since version Feb: 27, 2016
Use the
useScientificNotation
property instead.
GetXCurrentRange(self)¶Get the xCurrentRange value.
Deprecated since version Feb: 27, 2016
Use the xCurrentRange
property instead.
GetXMaxRange(self)¶Get the xMaxRange value.
Deprecated since version Feb: 27, 2016
Use the xMaxRange
property instead.
GetXSpec(self)¶Get the xSpec value.
Deprecated since version Feb: 27, 2016
Use the xSpec
property instead.
GetXY(self, event)¶Wrapper around _getXY, which handles log scales
GetYCurrentRange(self)¶Get the yCurrentRange value.
Deprecated since version Feb: 27, 2016
Use the yCurrentRange
property instead.
GetYMaxRange(self)¶Get the yMaxRange value.
Deprecated since version Feb: 27, 2016
Use the yMaxRange
property instead.
GetYSpec(self)¶Get the ySpec value.
Deprecated since version Feb: 27, 2016
Use the ySpec
property instead.
OnLeave(self, event)¶Used to erase pointLabel when mouse outside window
OnMotion(self, event)¶OnMouseDoubleClick(self, event)¶OnMouseLeftDown(self, event)¶OnMouseLeftUp(self, event)¶OnMouseRightDown(self, event)¶OnPaint(self, event)¶OnScroll(self, evt)¶OnSize(self, event)¶PageSetup(self)¶Brings up the page setup dialog
PositionScreenToUser(self, pntXY)¶Converts Screen position to User Coordinates
PositionUserToScreen(self, pntXY)¶Converts User position to Screen Coordinates
Printout(self, paper=None)¶Print current plot.
PrintPreview(self)¶Print-preview current plot.
Redraw(self, dc=None)¶Redraw the existing plot.
Reset(self)¶Unzoom the plot.
SaveFile(self, fileName='')¶Saves the file to the type specified in the extension. If no file
name is specified a dialog box is provided. Returns True if
sucessful, otherwise False.
.bmp Save a Windows bitmap file. .xbm Save an X bitmap file. .xpm Save an XPM bitmap file. .png Save a Portable Network Graphics file. .jpg Save a Joint Photographic Experts Group file.
ScrollRight(self, units)¶Move view right number of axis units.
ScrollUp(self, units)¶Move view up number of axis units.
SetCursor(self, cursor)¶SetEnableAntiAliasing(self, enableAntiAliasing)¶Set the enableAntiAliasing value.
Deprecated since version Feb: 27, 2016
Use the
enableAntiAliasing
property instead.
SetEnableCenterLines(self, value)¶Set the enableCenterLines value.
Deprecated since version Feb: 27, 2016
Use the enableCenterLines
property instead.
SetEnableDiagonals(self, value)¶Set the enableDiagonals value.
Deprecated since version Feb: 27, 2016
Use the enableDiagonals
property instead.
SetEnableDrag(self, value)¶Set the enableDrag value.
Deprecated since version Feb: 27, 2016
Use the enableDrag
property instead.
SetEnableGrid(self, value)¶Set the enableGrid value.
Deprecated since version Feb: 27, 2016
Use the enableGrid
property instead.
SetEnableHiRes(self, enableHiRes)¶Set the enableHiRes value.
Deprecated since version Feb: 27, 2016
Use the enableHiRes
property instead.
SetEnableLegend(self, value)¶Set the enableLegend value.
Deprecated since version Feb: 27, 2016
Use the enableLegend
property instead.
SetEnablePointLabel(self, value)¶Set the enablePointLabel value.
Deprecated since version Feb: 27, 2016
Use the enablePointLabel
property instead.
SetEnableTitle(self, value)¶Set the enableTitle value.
Deprecated since version Feb: 27, 2016
Use the enableTitle
property instead.
SetEnableZoom(self, value)¶Set the enableZoom value.
Deprecated since version Feb: 27, 2016
Use the enableZoom
property instead.
SetFontSizeAxis(self, point=10)¶Set the tick and axis label font size (default is 10 point)
Deprecated since version Feb: 27, 2016
Use the fontSizeAxis
property
instead.
SetFontSizeLegend(self, point=7)¶Set legend font size (default is 7 point)
Deprecated since version Feb: 27, 2016
Use the :attr:`~wx.lib.plot.plotcanvas.PlotCanvas.fontSizeLegend’ property instead.
SetFontSizeTitle(self, point=15)¶Set Title font size (default is 15 point)
Deprecated since version Feb: 27, 2016
Use the fontSizeTitle
property instead.
setLogScale(self, logscale)¶Set the log scale boolean value.
Deprecated since version Feb: 27, 2016
Use the logScale
property instead.
SetPointLabelFunc(self, func)¶Set the enablePointLabel value.
Deprecated since version Feb: 27, 2016
Use the enablePointLabel
property instead.
SetShowScrollbars(self, value)¶Set the showScrollbars value.
Deprecated since version Feb: 27, 2016
Use the showScrollbars
property instead.
SetUseScientificNotation(self, useScientificNotation)¶Set the useScientificNotation value.
Deprecated since version Feb: 27, 2016
Use the
useScientificNotation
property instead.
SetXSpec(self, spectype='auto')¶Set the xSpec value.
Deprecated since version Feb: 27, 2016
Use the xSpec
property instead.
SetYSpec(self, spectype='auto')¶Set the ySpec value.
Deprecated since version Feb: 27, 2016
Use the ySpec
property instead.
UpdatePointLabel(self, mDataDict)¶Updates the pointLabel point on screen with data contained in mDataDict.
mDataDict will be passed to your function set by SetPointLabelFunc. It can contain anything you want to display on the screen at the scaledXY point you specify.
This function can be called from parent window with onClick, onMotion events etc.
Zoom(self, Center, Ratio)¶Zoom on the plot Centers on the X,Y coords given in Center Zooms by the Ratio = (Xratio, Yratio) given
absScale¶The absScale value as a 2-tuple of bools:
(x_axis_is_abs_scale, y_axis_is_abs_scale).
| Getter: | Returns the value of absScale. |
|---|---|
| Setter: | Sets the value of absScale. |
| Type: | tuple of bools, length 2 |
| Raise: | TypeError when setting an invalid value. |
axesPen¶The wx.Pen used to draw the axes lines on the plot.
| Getter: | Returns the wx.Pen used for drawing the axes
lines. |
|---|---|
| Setter: | Sets the wx.Pen use for drawging the axes lines. |
| Type: | wx.Pen |
| Raise: | TypeError when setting a value that is not a
wx.Pen. |
centerLinePen¶The wx.Pen used to draw the center lines on the plot.
| Getter: | Returns the wx.Pen used for drawing the center
lines. |
|---|---|
| Setter: | Sets the wx.Pen use for drawging the center lines. |
| Type: | wx.Pen |
| Raise: | TypeError when setting a value that is not a
wx.Pen. |
diagonalPen¶The wx.Pen used to draw the diagonal lines on the plot.
| Getter: | Returns the wx.Pen used for drawing the diagonal
lines. |
|---|---|
| Setter: | Sets the wx.Pen use for drawging the diagonal lines. |
| Type: | wx.Pen |
| Raise: | TypeError when setting a value that is not a
wx.Pen. |
enableAntiAliasing¶The current enableAntiAliasing value.
| Getter: | Returns the value of enableAntiAliasing. |
|---|---|
| Setter: | Sets the value of enableAntiAliasing. |
| Type: | bool |
| Raises: | TypeError if setting a non-boolean value. |
enableAxes¶The current enableAxes value.
| Getter: | Returns the value of enableAxes. |
|---|---|
| Setter: | Sets the value of enableAxes. |
| Type: | bool, 2-tuple of bool, or 4-tuple of bool |
| Raises: | TypeError if setting an invalid value. |
| Raises: | ValueError if the tuple has incorrect length. |
If bool, enable or disable all axis
If 2-tuple, enable or disable the bottom or left axes: (bottom,
left)
If 4-tuple, enable or disable each axis individually: (bottom,
left, top, right)
enableAxesLabels¶The current enableAxesLabels value.
| Getter: | Returns the value of enableAxesLabels. |
|---|---|
| Setter: | Sets the value of enableAxesLabels. |
| Type: | bool |
| Raises: | TypeError if setting an invalid value. |
enableAxesValues¶The current enableAxesValues value.
| Getter: | Returns the value of enableAxesValues. |
|---|---|
| Setter: | Sets the value of enableAxesValues. |
| Type: | bool, 2-tuple of bool, or 4-tuple of bool |
| Raises: | TypeError if setting an invalid value. |
| Raises: | ValueError if the tuple has incorrect length. |
If bool, enable or disable all axis values
If 2-tuple, enable or disable the bottom or left axes values:
(bottom,
left)
If 4-tuple, enable or disable each axis value individually:
(bottom,
left, top, right)
enableCenterLines¶The current enableCenterLines value.
| Getter: | Returns the value of enableCenterLines. |
|---|---|
| Setter: | Sets the value of enableCenterLines. |
| Type: | bool or str |
| Raises: | TypeError if setting an invalid value. |
If set to a single boolean value, then both horizontal and vertical lines will be enabled or disabled.
If a string, must be one of ('Horizontal', 'Vertical').
enableDiagonals¶The current enableDiagonals value.
| Getter: | Returns the value of enableDiagonals. |
|---|---|
| Setter: | Sets the value of enableDiagonals. |
| Type: | bool or str |
| Raises: | TypeError if setting an invalid value. |
If set to a single boolean value, then both diagonal lines will be enabled or disabled.
If a string, must be one of ('Bottomleft-Topright',
'Bottomright-Topleft').
enableDrag¶The current enableDrag value.
| Getter: | Returns the value of enableDrag. |
|---|---|
| Setter: | Sets the value of enableDrag. |
| Type: | bool |
| Raises: | TypeError if setting a non-boolean value. |
Note
This is mutually exclusive with
enableZoom. Setting
one will disable the other.
See also
enableGrid¶The current enableGrid value.
| Getter: | Returns the value of enableGrid. |
|---|---|
| Setter: | Sets the value of enableGrid. |
| Type: | bool or 2-tuple of bools |
| Raises: | TypeError if setting an invalid value. |
If set to a single boolean value, then both X and y grids will be
enabled (enableGrid = True) or disabled (enableGrid = False).
If a 2-tuple of bools, the 1st value is the X (vertical) grid and the 2nd value is the Y (horizontal) grid.
enableHiRes¶The current enableHiRes value.
| Getter: | Returns the value of enableHiRes. |
|---|---|
| Setter: | Sets the value of enableHiRes. |
| Type: | bool |
| Raises: | TypeError if setting a non-boolean value. |
enableLegend¶The current enableLegend value.
| Getter: | Returns the value of enableLegend. |
|---|---|
| Setter: | Sets the value of enableLegend. |
| Type: | bool |
| Raises: | TypeError if setting a non-boolean value. |
enablePlotTitle¶The current enablePlotTitle value.
| Getter: | Returns the value of enablePlotTitle. |
|---|---|
| Setter: | Sets the value of enablePlotTitle. |
| Type: | bool |
| Raises: | TypeError if setting an invalid value. |
enablePointLabel¶The current enablePointLabel value.
| Getter: | Returns the value of enablePointLabel. |
|---|---|
| Setter: | Sets the value of enablePointLabel. |
| Type: | bool |
| Raises: | TypeError if setting a non-boolean value. |
enableTicks¶The current enableTicks value.
| Getter: | Returns the value of enableTicks. |
|---|---|
| Setter: | Sets the value of enableTicks. |
| Type: | bool, 2-tuple of bool, or 4-tuple of bool |
| Raises: | TypeError if setting an invalid value. |
| Raises: | ValueError if the tuple has incorrect length. |
If bool, enable or disable all ticks
If 2-tuple, enable or disable the bottom or left ticks:
(bottom, left)
If 4-tuple, enable or disable each tick side individually:
(bottom, left, top, right)
enableTitle¶The current enableTitle value.
| Getter: | Returns the value of enableTitle. |
|---|---|
| Setter: | Sets the value of enableTitle. |
| Type: | bool |
| Raises: | TypeError if setting a non-boolean value. |
enableXAxisLabel¶The current enableXAxisLabel value.
| Getter: | Returns the value of enableXAxisLabel. |
|---|---|
| Setter: | Sets the value of enableXAxisLabel. |
| Type: | bool |
| Raises: | TypeError if setting an invalid value. |
enableYAxisLabel¶The current enableYAxisLabel value.
| Getter: | Returns the value of enableYAxisLabel. |
|---|---|
| Setter: | Sets the value of enableYAxisLabel. |
| Type: | bool |
| Raises: | TypeError if setting an invalid value. |
enableZoom¶The current enableZoom value.
| Getter: | Returns the value of enableZoom. |
|---|---|
| Setter: | Sets the value of enableZoom. |
| Type: | bool |
| Raises: | TypeError if setting a non-boolean value. |
Note
This is mutually exclusive with
enableDrag. Setting
one will disable the other.
See also
fontSizeAxis¶The current tick and axis label font size in points.
Default is 10pt font.
| Getter: | Returns the value of fontSizeAxis. |
|---|---|
| Setter: | Sets the value of fontSizeAxis. |
| Type: | int or float |
fontSizeLegend¶The current Legned font size in points.
Default is 7pt font.
| Getter: | Returns the value of fontSizeLegend. |
|---|---|
| Setter: | Sets the value of fontSizeLegend. |
| Type: | int or float |
fontSizeTitle¶The current Title font size in points.
Default is 15pt font.
| Getter: | Returns the value of fontSizeTitle. |
|---|---|
| Setter: | Sets the value of fontSizeTitle. |
| Type: | int or float |
gridPen¶The wx.Pen used to draw the grid lines on the plot.
| Getter: | Returns the wx.Pen used for drawing the grid
lines. |
|---|---|
| Setter: | Sets the wx.Pen use for drawging the grid lines. |
| Type: | wx.Pen |
| Raise: | TypeError when setting a value that is not a
wx.Pen. |
logScale¶The logScale value as a 2-tuple of bools:
(x_axis_is_log_scale, y_axis_is_log_scale).
| Getter: | Returns the value of logScale. |
|---|---|
| Setter: | Sets the value of logScale. |
| Type: | tuple of bools, length 2 |
| Raise: | TypeError when setting an invalid value. |
pageSetupData¶See pageSetupData
pointLabelFunc¶The current pointLabelFunc value.
| Getter: | Returns the value of pointLabelFunc. |
|---|---|
| Setter: | Sets the value of pointLabelFunc. |
| Type: | function |
TODO: More information is needed. Sets the function with custom code for pointLabel drawing
print_data¶See print_data
showScrollbars¶The current showScrollbars value.
| Getter: | Returns the value of showScrollbars. |
|---|---|
| Setter: | Sets the value of showScrollbars. |
| Type: | bool |
| Raises: | TypeError if setting a non-boolean value. |
tickLength¶The length of the tick marks on an axis.
| Getter: | Returns the length of the tick marks. |
|---|---|
| Setter: | Sets the length of the tick marks. |
| Type: | tuple of (xlength, ylength): int or float |
| Raise: | TypeError when setting a value that is not an int or float. |
tickLengthPrinterScale¶tickPen¶The wx.Pen used to draw the tick marks on the plot.
| Getter: | Returns the wx.Pen used for drawing the tick marks. |
|---|---|
| Setter: | Sets the wx.Pen use for drawging the tick marks. |
| Type: | wx.Pen |
| Raise: | TypeError when setting a value that is not a
wx.Pen. |
useScientificNotation¶The current useScientificNotation value.
| Getter: | Returns the value of useScientificNotation. |
|---|---|
| Setter: | Sets the value of useScientificNotation. |
| Type: | bool |
| Raises: | TypeError if setting a non-boolean value. |
xCurrentRange¶The plots’ X range of the currently displayed portion as
a tuple of (min, max)
| Getter: | Returns the value of xCurrentRange. |
|---|
See also
xMaxRange¶The plots’ maximum X range as a tuple of (min, max).
| Getter: | Returns the value of xMaxRange. |
|---|
See also
xSpec¶Defines the X axis type.
Default is ‘auto’.
| Getter: | Returns the value of xSpec. |
|---|---|
| Setter: | Sets the value of xSpec. |
| Type: | str, int, or length-2 sequence of floats |
| Raises: | TypeError if setting an invalid value. |
Valid strings: + ‘none’ - shows no axis or tick mark values + ‘min’ - shows min bounding box values + ‘auto’ - rounds axis range to sensible values
Other valid values: + <number> - like ‘min’, but with <number> tick marks + list or tuple: a list of (min, max) values. Must be length 2.
See also
yCurrentRange¶The plots’ Y range of the currently displayed portion as
a tuple of (min, max)
| Getter: | Returns the value of yCurrentRange. |
|---|
See also
yMaxRange¶The plots’ maximum Y range as a tuple of (min, max).
| Getter: | Returns the value of yMaxRange. |
|---|
See also
ySpec¶Defines the Y axis type.
Default is ‘auto’.
| Getter: | Returns the value of xSpec. |
|---|---|
| Setter: | Sets the value of xSpec. |
| Type: | str, int, or length-2 sequence of floats |
| Raises: | TypeError if setting an invalid value. |
Valid strings: + ‘none’ - shows no axis or tick mark values + ‘min’ - shows min bounding box values + ‘auto’ - rounds axis range to sensible values
Other valid values: + <number> - like ‘min’, but with <number> tick marks + list or tuple: a list of (min, max) values. Must be length 2.
See also


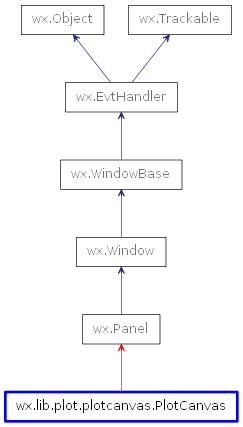
 Inheritance diagram for class PlotCanvas: