Navigation

- Home |
- Gallery |
- API Docs »
- wx.lib »
- wx.lib.plot »
- wx.lib.plot.polyobjects »
- wx.lib.plot.polyobjects.PolyHistogram
- index
- modules |
- next |
- previous |

 wx.lib.plot.polyobjects.PolyHistogram
Creates a PolyHistogram object.
| param hist: | The histogram data. |
|---|---|
| type hist: | sequence of y values that define the heights of the bars |
| param binspec: | The bin specification. |
| type binspec: | sequence of x values that define the edges of the bins |
| param **attr: | keyword attributes |
| Keyword and Default | Description | Type |
|---|---|---|
edgecolour='black' |
edge color | wx.Colour |
edgewidth=3 |
edge width | float |
edgestyle=wx.PENSTYLE_SOLID |
edge style | wx.PenStyle |
fillcolour='blue' |
fill color | wx.Colour |
fillstyle=wx.BRUSHSTYLE_SOLID |
fill style | wx.BrushStyle |
legend='' |
legend string | str |
Tip
Use np.histogram() to easily create your histogram parameters:
hist_data, binspec = np.histogram(data)
hist_plot = PolyHistogram(hist_data, binspec)
Important
len(binspec) must equal len(hist) + 1.
Warning
All methods except __init__ are private.
 Class API
PolyHistogram(PolyBarsBase)¶Creates a PolyHistogram object.
| Parameters: |
|
|---|
| Keyword and Default | Description | Type |
|---|---|---|
edgecolour='black' |
edge color | wx.Colour |
edgewidth=3 |
edge width | float |
edgestyle=wx.PENSTYLE_SOLID |
edge style | wx.PenStyle |
fillcolour='blue' |
fill color | wx.Colour |
fillstyle=wx.BRUSHSTYLE_SOLID |
fill style | wx.BrushStyle |
legend='' |
legend string | str |
Tip
Use np.histogram() to easily create your histogram parameters:
hist_data, binspec = np.histogram(data)
hist_plot = PolyHistogram(hist_data, binspec)
Important
len(binspec) must equal len(hist) + 1.
Warning
All methods except __init__ are private.
__init__(self, hist, binspec, **attr)¶calc_rect(self, y, low, high)¶Calculate the rectangle for plotting.
draw(self, dc, printerScale, coord=None)¶Draw the bars


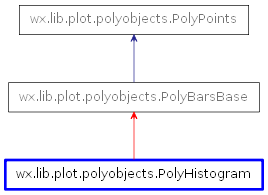
 Inheritance diagram for class PolyHistogram: