What’s New in WebStorm for Angular
The most recent release of Angular adds lots of new features to the CLI that make it easier for you to update and add new features to your app. The recent WebStorm 2018.2 major update adds integration with these new CLI commands. Let’s have a look at these and some other new features in action!
To start off, we will create an Angular app with Angular CLI.
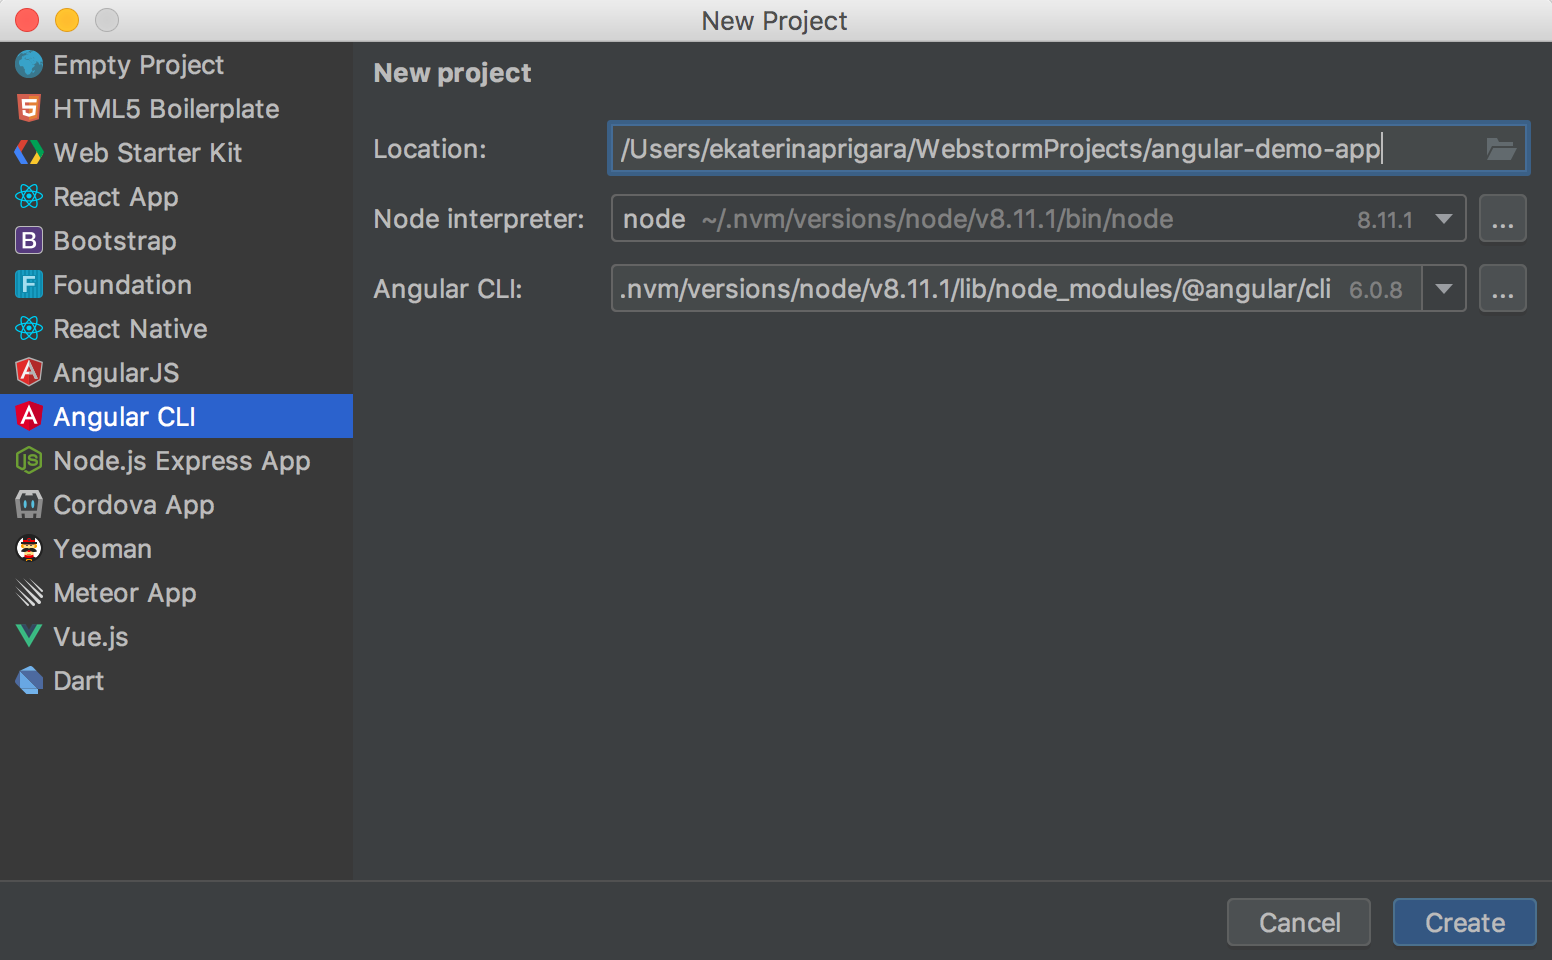
You can always create a new Angular project from the IDE’s Welcome screen: click Create new project, then select Angular CLI from the list on the left, name your new project and click Create. WebStorm will use the Angular CLI installed globally on your machine or use its latest version via npx.

Adding new features to the app with ng add
ng add helps you add new capabilities to your app — this command will install the dependencies and then invoke the installation script which will take care of all the rest.
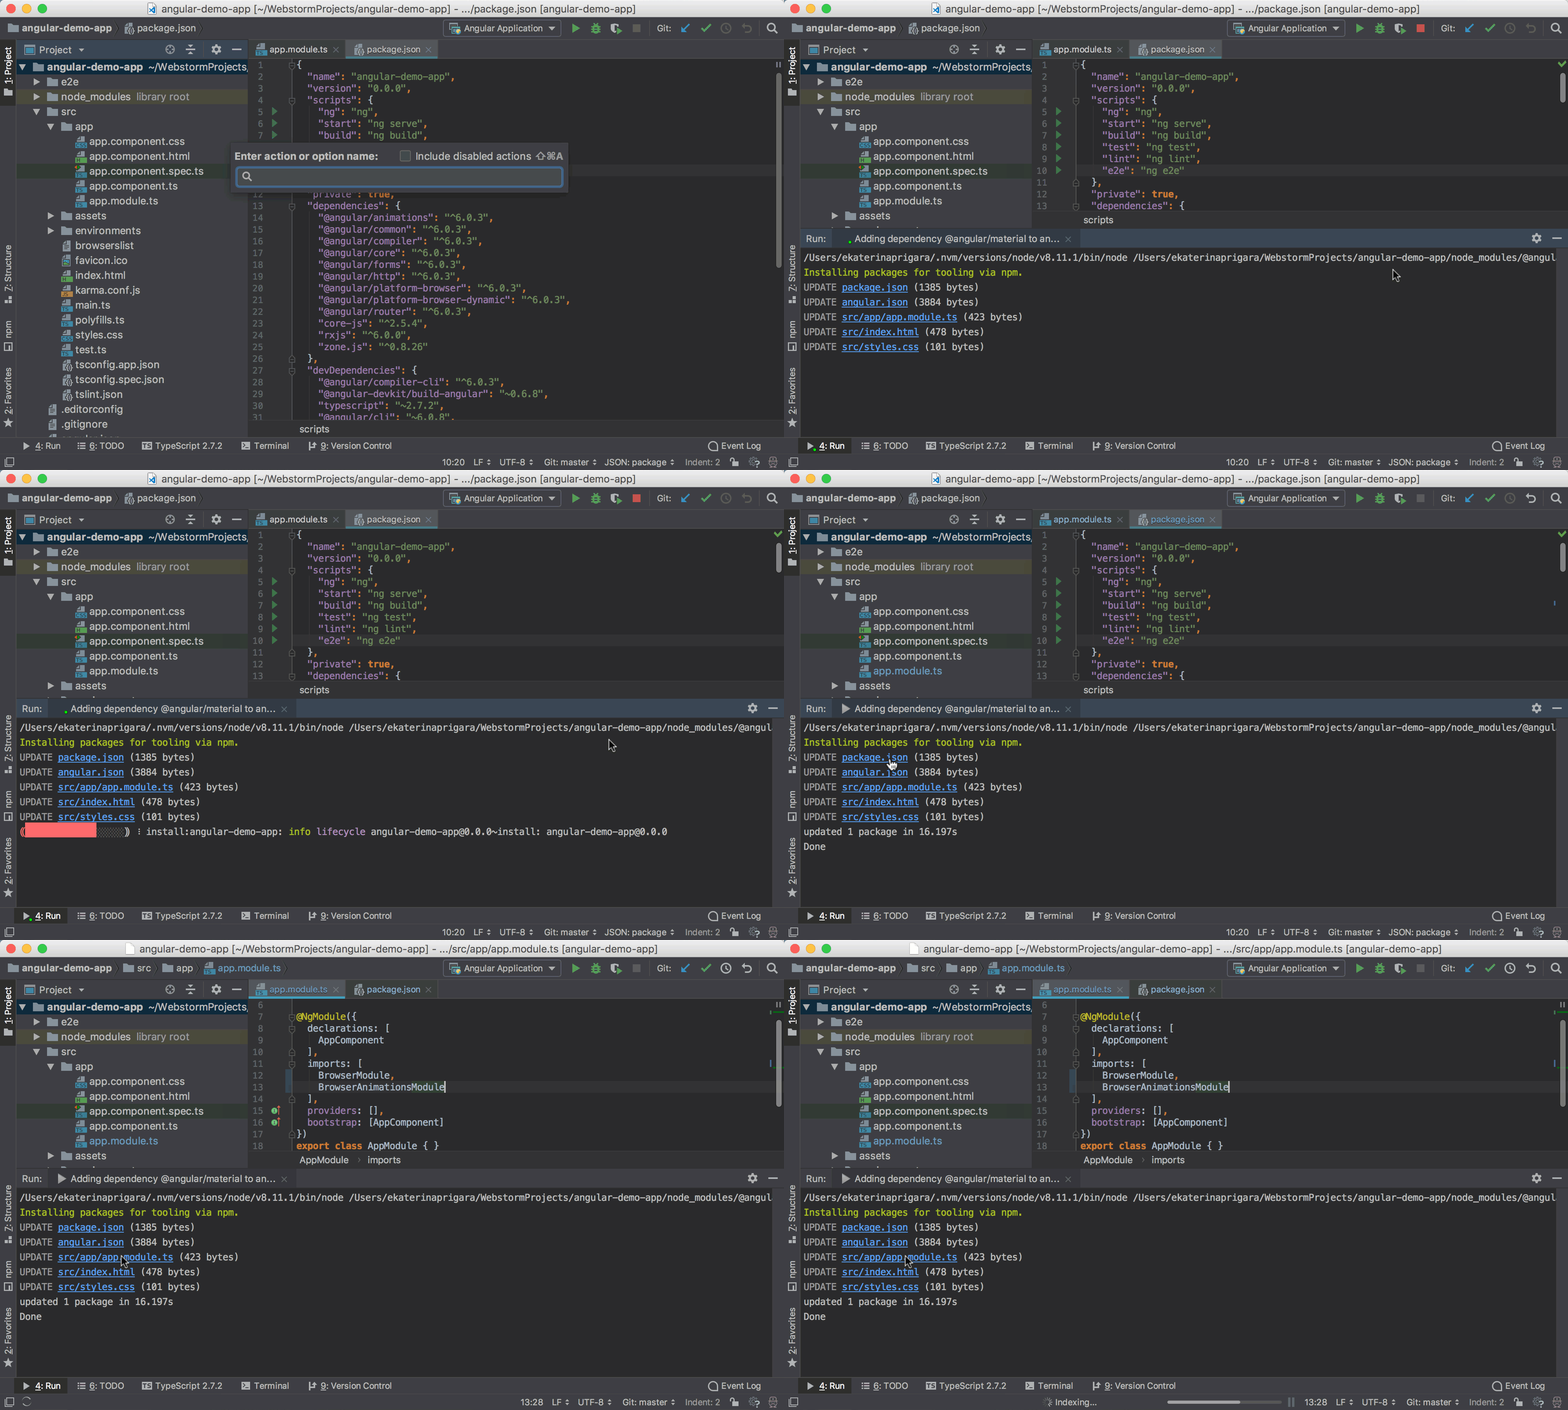
In WebStorm 2018.2, you can add the libraries that support installation with ng add using the new Angular Dependency action available via the Find Action (Cmd-Shift-A/Ctrl+Shift+A) pop-up or the New… pop-up (Cmd-N/Alt+Insert) in the Project view.
In the list, you can select which library you want to add. Right now it contains a predefined list of libraries that we know have ng add support but you can also specify the name of the package yourself.
Let’s select Angular Material and add it to our project:

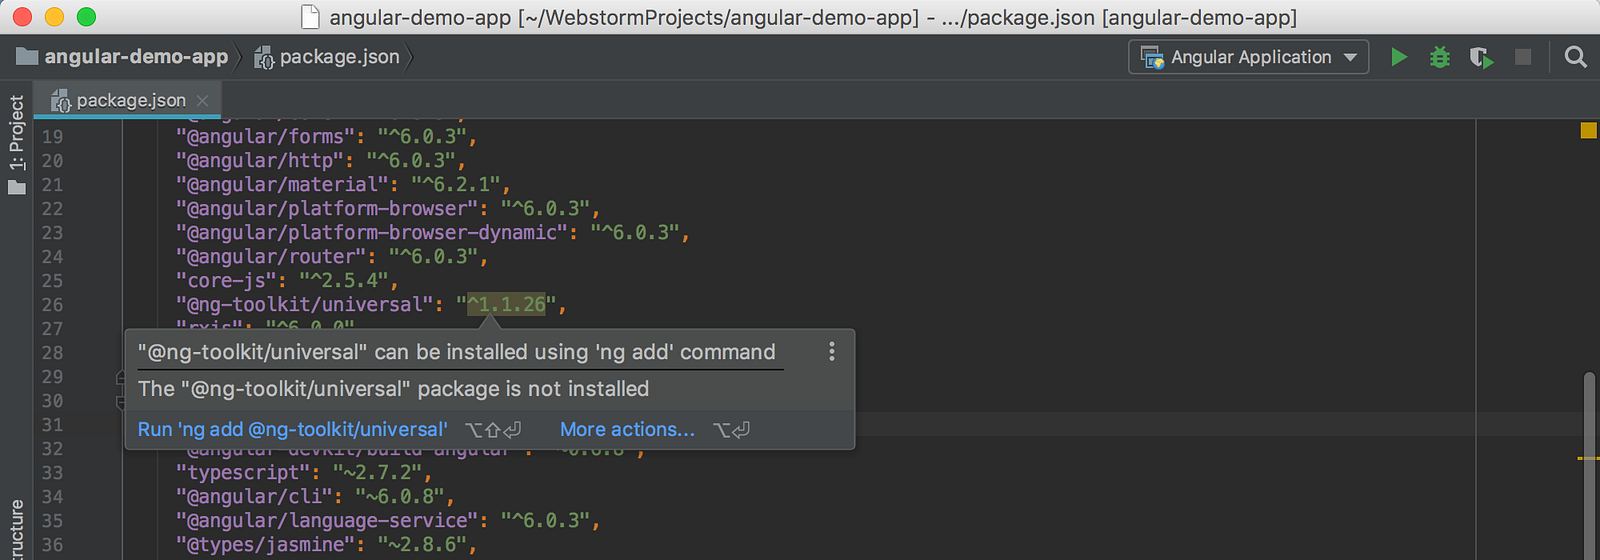
If you add a dependency to package.json, which WebStorm knows supports ng add, it will suggest installing it using ng add:

Even if a dependency is already installed, it can still make sense to reinstall it with ng add — press Alt-Enter on the package name and select Reinstall with ‘ng add’:


Using schematics
With the Angular Schematic action, you can use schematics, which are special scripts that can generate the code for things like new components, directives, and services etc. These are the standard schematics that come with Angular CLI itself which you could use in WebStorm for some time already.
Now the list also includes the schematics provided by other dependencies, e.g. Angular Material.
Let’s add a Material dashboard to our app: use Find Action (Cmd-Shift-A/Ctrl+Shift+A) — Angular Schematic or in the Project view, press Cmd-N/Alt+Insert and select Angular Schematic and then select materialDashboard from the list. Specify the name of the component, you can also pass additional configuration options.

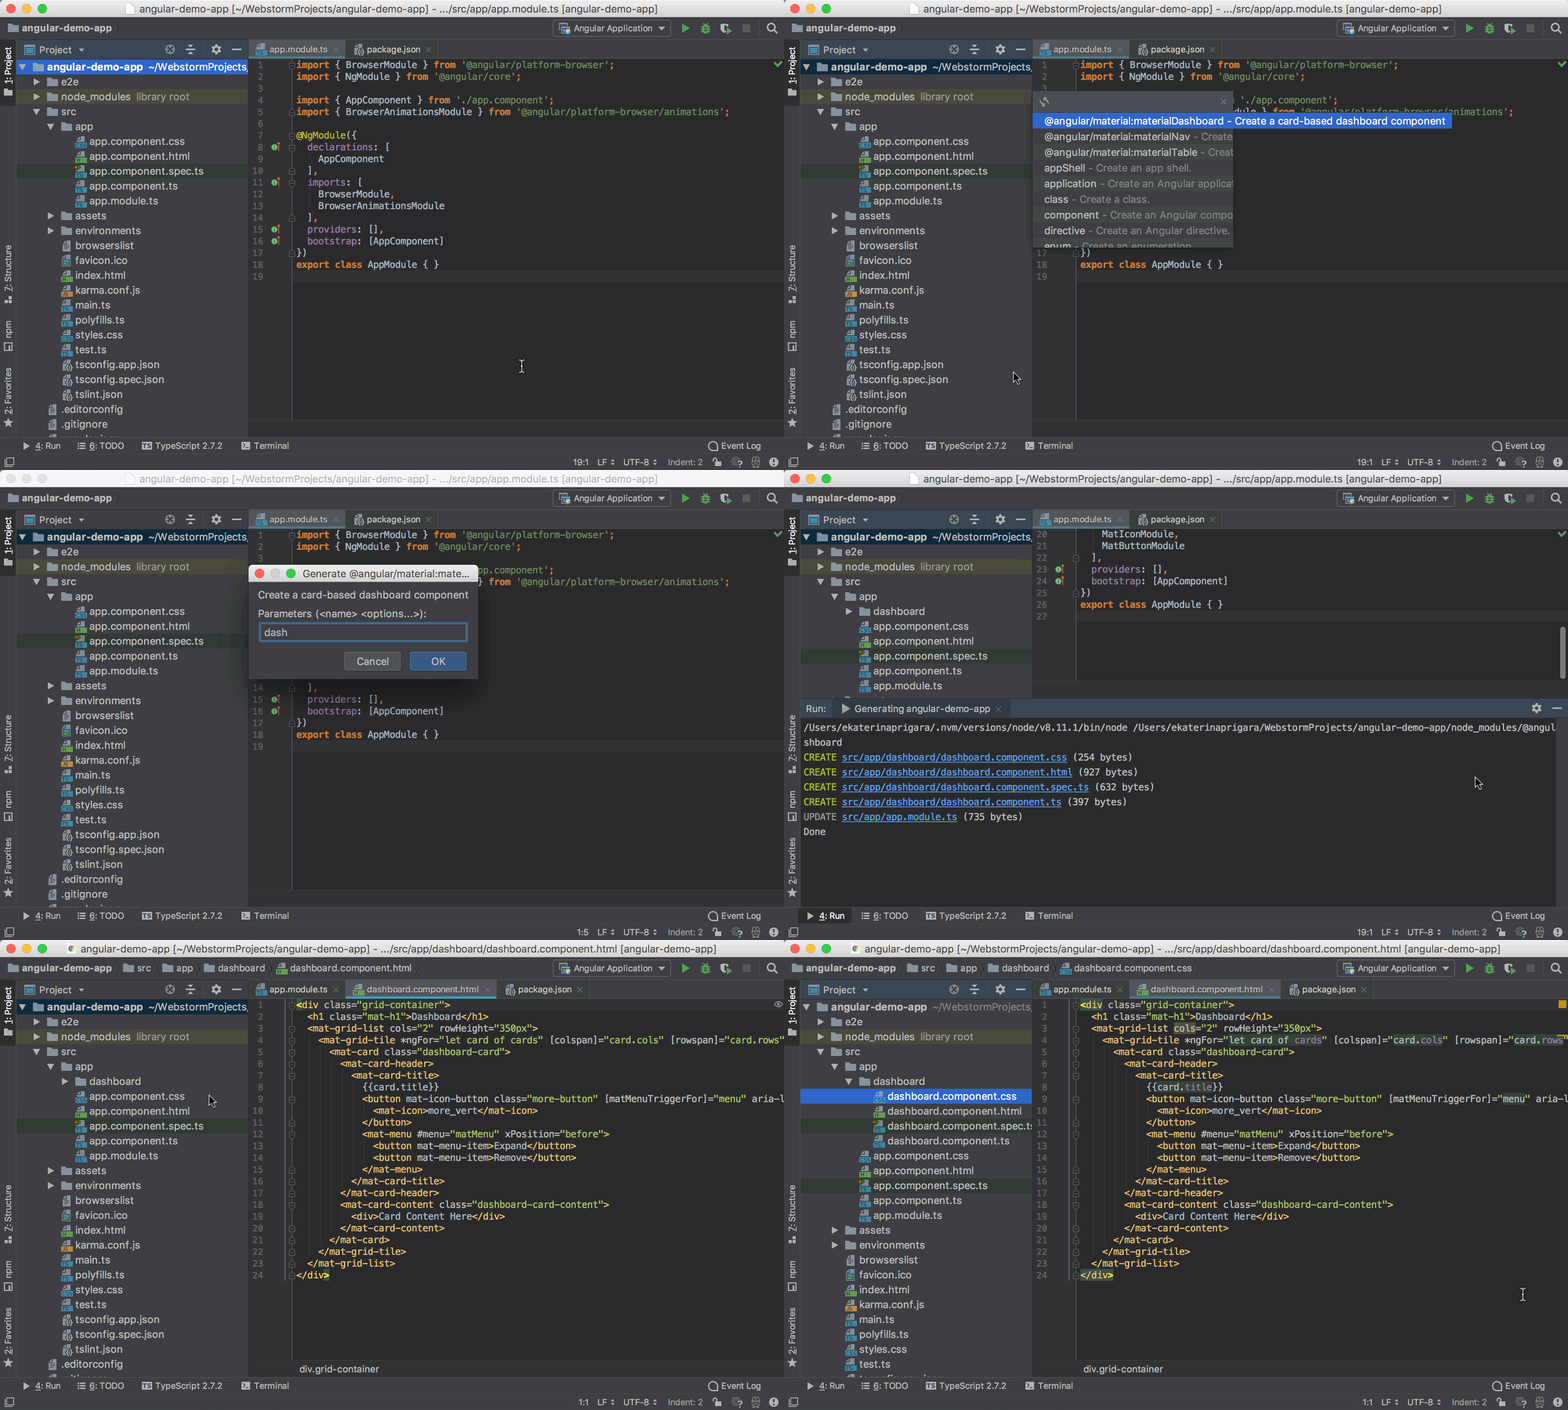
We can now use the newly created Material <dashboard> component in app.component.html.
Updated code snippets
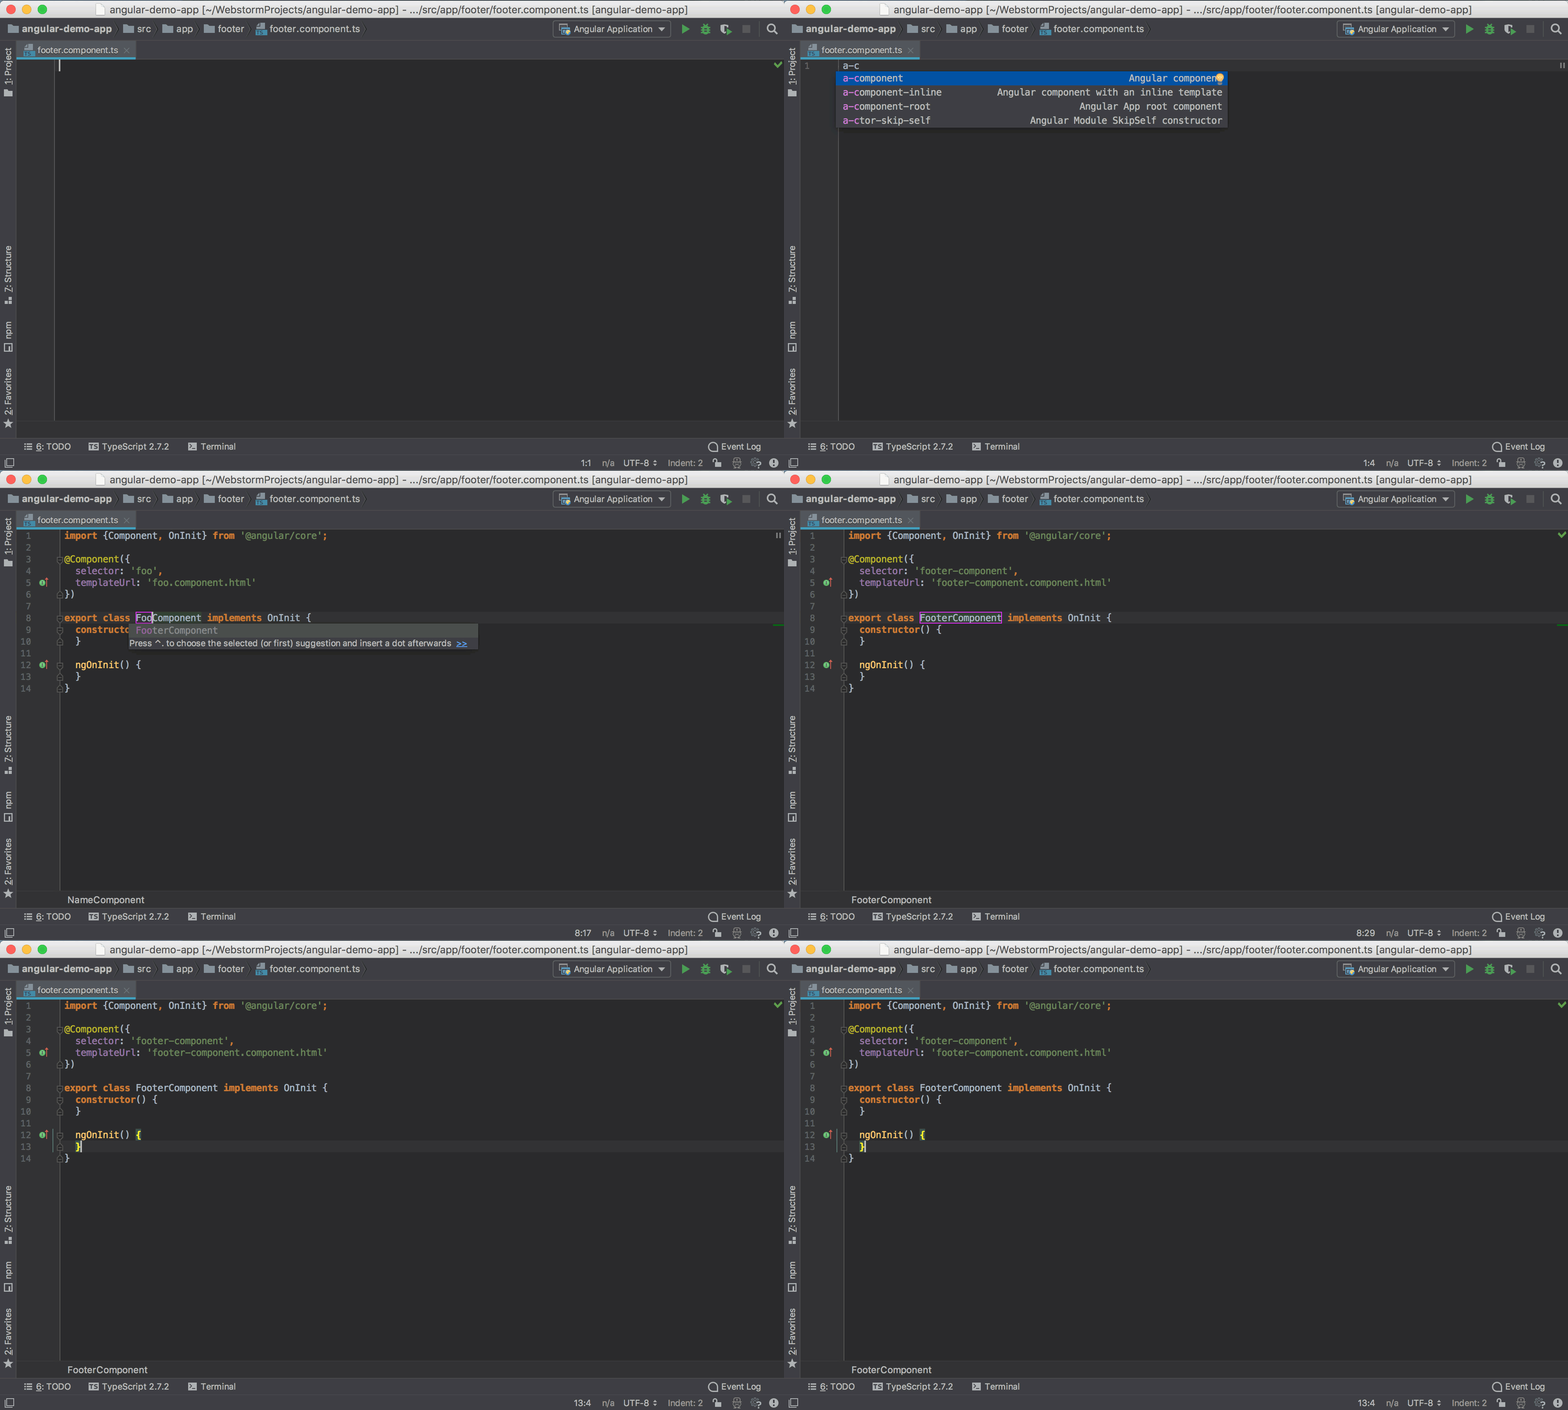
WebStorm ships a collection of Angular code snippets developed by John Papa and these snippets were also updated for the Angular 6 release.
To use a snippet, you can either type its abbreviation and press Tab to expand it or select it from the code completion suggestions. You can see all the available snippets and add your custom snippets in Preferences | Editor | Live Templates.

Rename component refactoring
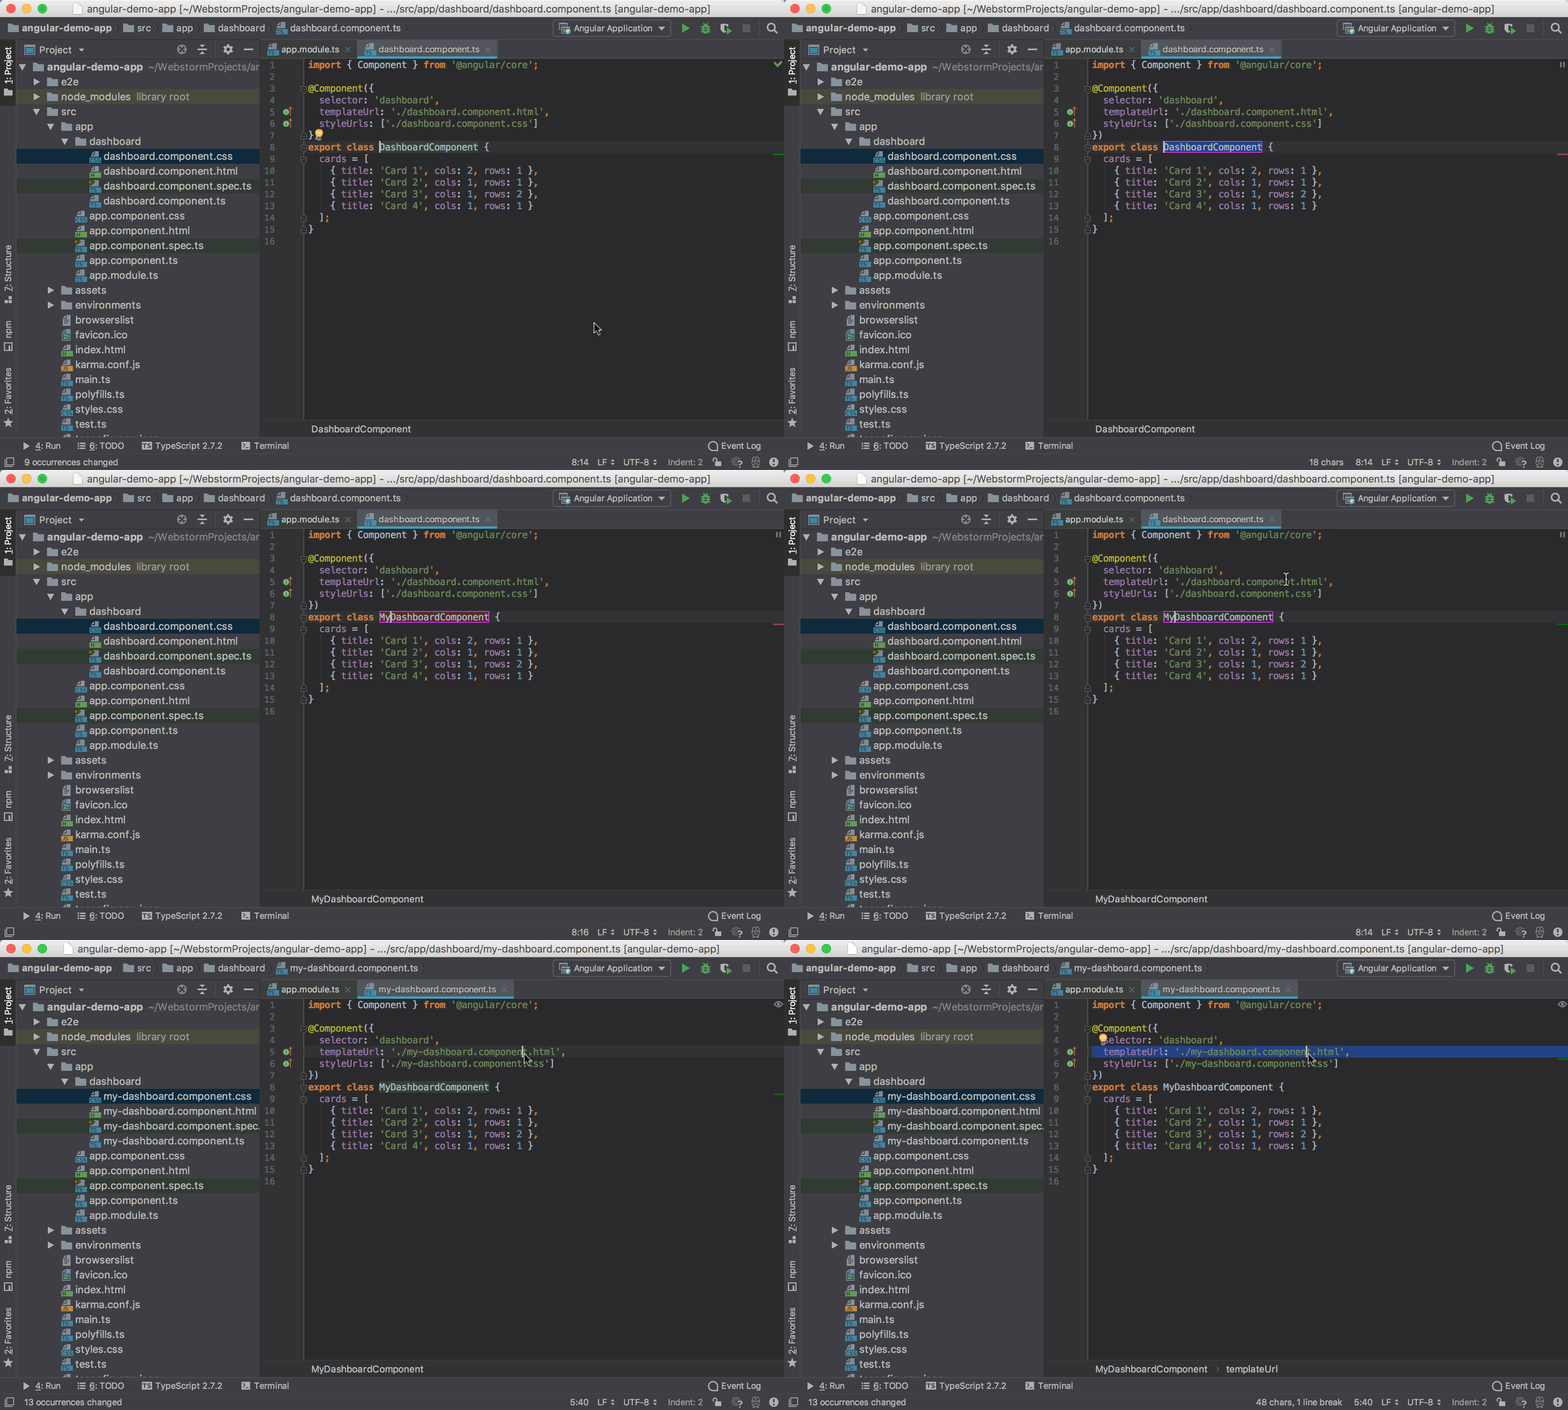
Another recent WebStorm improvement for Angular is that now the Rename refactoring for the component not only updates all its usages and imports but also updates the names of all related files: *.component.ts, *.component.html, *.component.css and *.component.spec.ts.

Run and debug your app
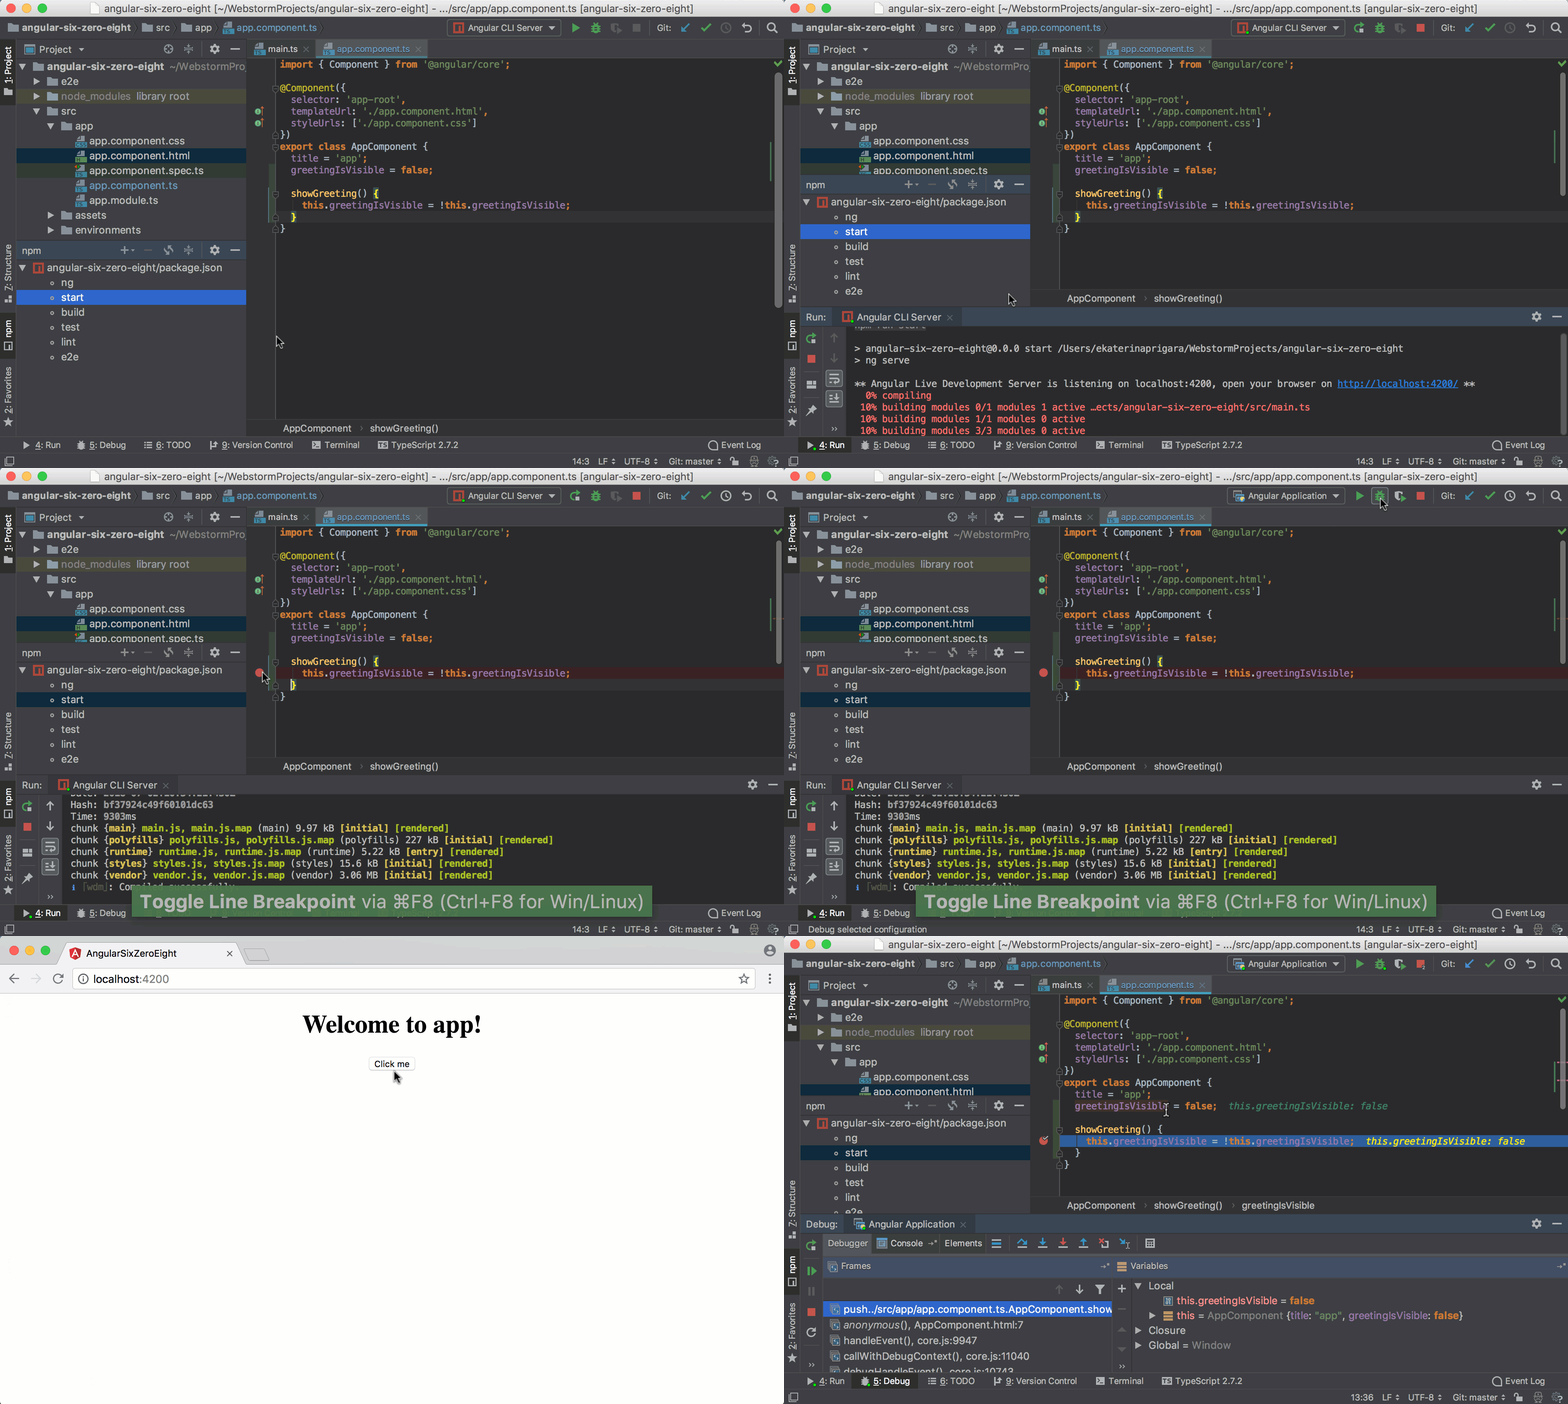
Now let’s see the result of our changes and run ng start to start our app. In the IDE you can double-click on the task name in the npm window on the left to start it.
If you want to debug the application, you can use WebStorm’s debugger and Chrome. Create and start a new JavaScript debug configuration in WebStorm with the localhost:4200 in the URL field. Starting with WebStorm 2018.2, this configuration is available straight away for any new Angular projects you create from the IDE’s Welcome Screen.
Put the breakpoints in your TypeScript code directly in the editor, then click on the bug icon next to configuration to start debugging. After the breakpoint is hit, you can step through your code, see the values of variables, use the debug console — all in the IDE.

To sum it all up, the new WebStorm 2018.2 improves a lot its integration with Angular CLI: you can now use the IDE actions instead of the command line to add new dependencies to your Angular app with ng add, and generate code using Angular Schematics. In addition to this, it’s now easier to rename the components and debug your app in WebStorm.
Download WebStorm 2018.2 from the JetBrains website and give these new features a try!