librosa.util.peak_pick
-
librosa.util.peak_pick(x, pre_max, post_max, pre_avg, post_avg, delta, wait)[source]¶ Uses a flexible heuristic to pick peaks in a signal.
A sample n is selected as an peak if the corresponding x[n] fulfills the following three conditions:
- x[n] == max(x[n - pre_max:n + post_max])
- x[n] >= mean(x[n - pre_avg:n + post_avg]) + delta
- n - previous_n > wait
where previous_n is the last sample picked as a peak (greedily).
This implementation is based on [1] and [2].
[1] Boeck, Sebastian, Florian Krebs, and Markus Schedl. “Evaluating the Online Capabilities of Onset Detection Methods.” ISMIR. 2012. [2] https://github.com/CPJKU/onset_detection/blob/master/onset_program.py Parameters: - x : np.ndarray [shape=(n,)]
input signal to peak picks from
- pre_max : int >= 0 [scalar]
number of samples before n over which max is computed
- post_max : int >= 1 [scalar]
number of samples after n over which max is computed
- pre_avg : int >= 0 [scalar]
number of samples before n over which mean is computed
- post_avg : int >= 1 [scalar]
number of samples after n over which mean is computed
- delta : float >= 0 [scalar]
threshold offset for mean
- wait : int >= 0 [scalar]
number of samples to wait after picking a peak
Returns: - peaks : np.ndarray [shape=(n_peaks,), dtype=int]
indices of peaks in x
Raises: - ParameterError
If any input lies outside its defined range
Examples
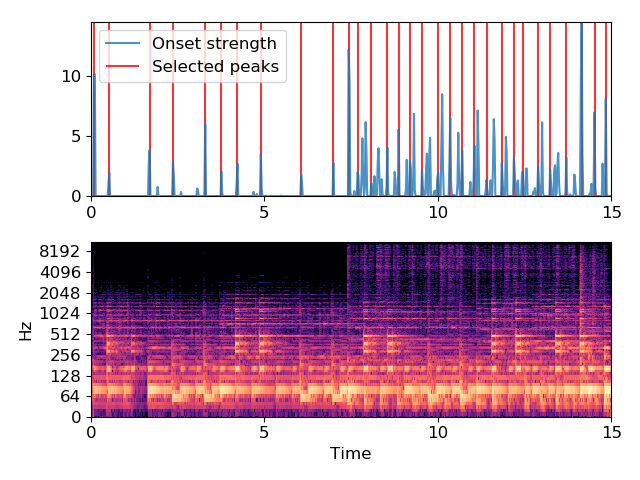
>>> y, sr = librosa.load(librosa.util.example_audio_file(), duration=15)
>>> onset_env = librosa.onset.onset_strength(y=y, sr=sr,
...                                          hop_length=512,
...                                          aggregate=np.median)
>>> peaks = librosa.util.peak_pick(onset_env, 3, 3, 3, 5, 0.5, 10)
>>> peaks
array([  4,  23,  73, 102, 142, 162, 182, 211, 261, 301, 320,
       331, 348, 368, 382, 396, 411, 431, 446, 461, 476, 491,
       510, 525, 536, 555, 570, 590, 609, 625, 639])
>>> import matplotlib.pyplot as plt
>>> times = librosa.frames_to_time(np.arange(len(onset_env)),
...                                sr=sr, hop_length=512)
>>> plt.figure()
>>> ax = plt.subplot(2, 1, 2)
>>> D = librosa.stft(y)
>>> librosa.display.specshow(librosa.amplitude_to_db(D, ref=np.max),
...                          y_axis='log', x_axis='time')
>>> plt.subplot(2, 1, 1, sharex=ax)
>>> plt.plot(times, onset_env, alpha=0.8, label='Onset strength')
>>> plt.vlines(times[peaks], 0,
...            onset_env.max(), color='r', alpha=0.8,
...            label='Selected peaks')
>>> plt.legend(frameon=True, framealpha=0.8)
>>> plt.axis('tight')
>>> plt.tight_layout()