
LineSeries QML Type
Presents data in line charts. More...
| Import Statement: | import QtCharts 2.3 |
| Instantiates: | QLineSeries |
| Inherits: |
Properties
Detailed Description
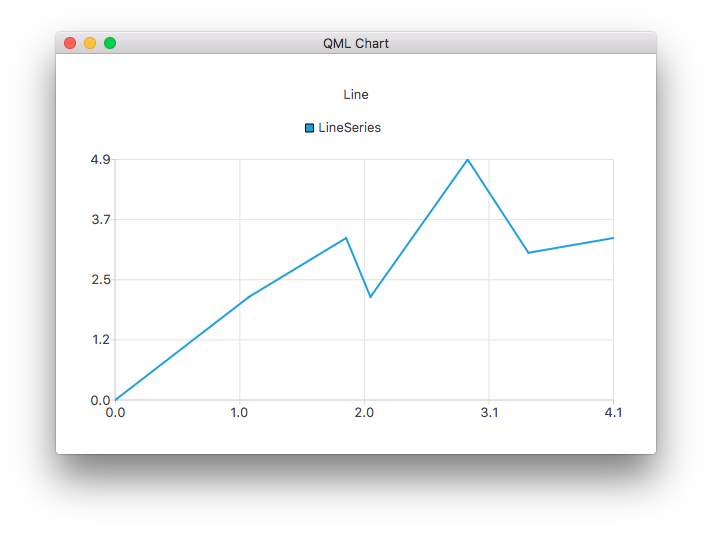
A line chart is used to show information as a series of data points connected by straight lines.
The following QML example shows how to create a simple line chart:
ChartView {
    title: "Line"
    anchors.fill: parent
    antialiasing: true

    LineSeries {
        name: "LineSeries"
        XYPoint { x: 0; y: 0 }
        XYPoint { x: 1.1; y: 2.1 }
        XYPoint { x: 1.9; y: 3.3 }
        XYPoint { x: 2.1; y: 2.1 }
        XYPoint { x: 2.9; y: 4.9 }
        XYPoint { x: 3.4; y: 3.0 }
        XYPoint { x: 4.1; y: 3.3 }
    }
}
Property Documentation
Controls the cap style of the line. Set to one of Qt.FlatCap, Qt.SquareCap or Qt.RoundCap. By default the cap style is Qt.SquareCap.
See also Qt::PenCapStyle.
count : int |
The number of data points in the series.
Controls the style of the line. Set to one of Qt.NoPen, Qt.SolidLine, Qt.DashLine, Qt.DotLine, Qt.DashDotLine, or Qt.DashDotDotLine. Using Qt.CustomDashLine is not supported in the QML API. By default, the style is Qt.SolidLine.
See also Qt::PenStyle.
width : real |
The width of the line. By default, the width is 2.0.
© 2019 The Qt Company Ltd. Documentation contributions included herein are the copyrights of their respective owners. The documentation provided herein is licensed under the terms of the GNU Free Documentation License version 1.3 as published by the Free Software Foundation. Qt and respective logos are trademarks of The Qt Company Ltd. in Finland and/or other countries worldwide. All other trademarks are property of their respective owners.