scipy.signal.lombscargle
- scipy.signal.lombscargle(x, y, freqs)
Computes the Lomb-Scargle periodogram.
The Lomb-Scargle periodogram was developed by Lomb [R205] and further extended by Scargle [R206] to find, and test the significance of weak periodic signals with uneven temporal sampling.
The computed periodogram is unnormalized, it takes the value (A**2) * N/4 for a harmonic signal with amplitude A for sufficiently large N.
Parameters: x : array_like
Sample times.
y : array_like
Measurement values.
freqs : array_like
Angular frequencies for output periodogram.
Returns: pgram : array_like
Lomb-Scargle periodogram.
Raises: ValueError
If the input arrays x and y do not have the same shape.
Notes
This subroutine calculates the periodogram using a slightly modified algorithm due to Townsend [R207] which allows the periodogram to be calculated using only a single pass through the input arrays for each frequency.
The algorithm running time scales roughly as O(x * freqs) or O(N^2) for a large number of samples and frequencies.
References
[R205] (1, 2) N.R. Lomb “Least-squares frequency analysis of unequally spaced data”, Astrophysics and Space Science, vol 39, pp. 447-462, 1976 [R206] (1, 2) J.D. Scargle “Studies in astronomical time series analysis. II - Statistical aspects of spectral analysis of unevenly spaced data”, The Astrophysical Journal, vol 263, pp. 835-853, 1982 [R207] (1, 2) R.H.D. Townsend, “Fast calculation of the Lomb-Scargle periodogram using graphics processing units.”, The Astrophysical Journal Supplement Series, vol 191, pp. 247-253, 2010 Examples
>>> import scipy.signal
>>> import matplotlib.pyplot as plt
First define some input parameters for the signal:
>>> A = 2.
>>> w = 1.
>>> phi = 0.5 * np.pi
>>> nin = 1000
>>> nout = 100000
>>> frac_points = 0.9 # Fraction of points to select
Randomly select a fraction of an array with timesteps:
>>> r = np.random.rand(nin)
>>> x = np.linspace(0.01, 10*np.pi, nin)
>>> x = x[r >= frac_points]
>>> normval = x.shape[0] # For normalization of the periodogram
Plot a sine wave for the selected times:
>>> y = A * np.sin(w*x+phi)
Define the array of frequencies for which to compute the periodogram:
>>> f = np.linspace(0.01, 10, nout)
Calculate Lomb-Scargle periodogram:
>>> import scipy.signal as signal
>>> pgram = signal.lombscargle(x, y, f)
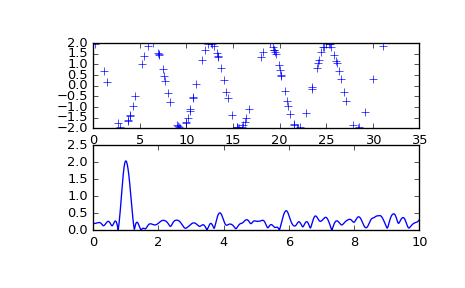
Now make a plot of the input data:
>>> plt.subplot(2, 1, 1)
<matplotlib.axes.AxesSubplot object at 0x102154f50>
>>> plt.plot(x, y, 'b+')
[<matplotlib.lines.Line2D object at 0x102154a10>]
Then plot the normalized periodogram:
>>> plt.subplot(2, 1, 2)
<matplotlib.axes.AxesSubplot object at 0x104b0a990>
>>> plt.plot(f, np.sqrt(4*(pgram/normval)))
[<matplotlib.lines.Line2D object at 0x104b2f910>]
>>> plt.show()