librosa.display.LogHzFormatter
-
class
librosa.display.LogHzFormatter(major=True)[source]¶ Ticker formatter for logarithmic frequency
Parameters: - major : bool
If True, ticks are always labeled.
If False, ticks are only labeled if the span is less than 2 octaves
See also
Examples
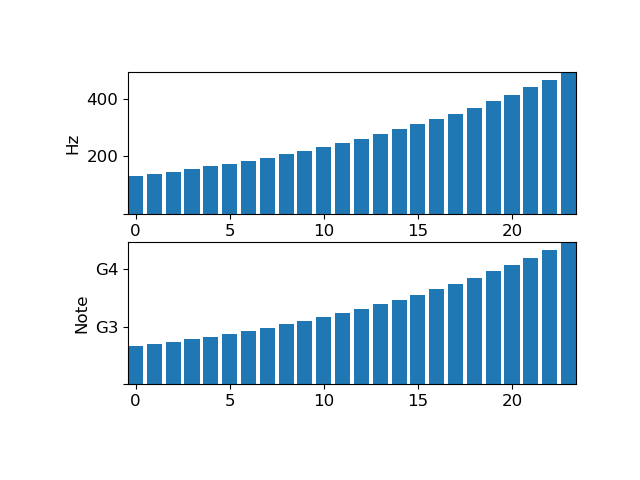
>>> import matplotlib.pyplot as plt
>>> values = librosa.midi_to_hz(np.arange(48, 72))
>>> plt.figure()
>>> ax1 = plt.subplot(2,1,1)
>>> ax1.bar(np.arange(len(values)), values)
>>> ax1.yaxis.set_major_formatter(librosa.display.LogHzFormatter())
>>> ax1.set_ylabel('Hz')
>>> ax2 = plt.subplot(2,1,2)
>>> ax2.bar(np.arange(len(values)), values)
>>> ax2.yaxis.set_major_formatter(librosa.display.NoteFormatter())
>>> ax2.set_ylabel('Note')