librosa.filters.mel
-
librosa.filters.mel(sr, n_fft, n_mels=128, fmin=0.0, fmax=None, htk=False, norm=1)[source]¶ Create a Filterbank matrix to combine FFT bins into Mel-frequency bins
Parameters: - sr : number > 0 [scalar]
sampling rate of the incoming signal
- n_fft : int > 0 [scalar]
number of FFT components
- n_mels : int > 0 [scalar]
number of Mel bands to generate
- fmin : float >= 0 [scalar]
lowest frequency (in Hz)
- fmax : float >= 0 [scalar]
highest frequency (in Hz). If None, use fmax = sr / 2.0
- htk : bool [scalar]
use HTK formula instead of Slaney
- norm : {None, 1, np.inf} [scalar]
if 1, divide the triangular mel weights by the width of the mel band (area normalization). Otherwise, leave all the triangles aiming for a peak value of 1.0
Returns: - M : np.ndarray [shape=(n_mels, 1 + n_fft/2)]
Mel transform matrix
Notes
This function caches at level 10.
Examples
>>> melfb = librosa.filters.mel(22050, 2048)
>>> melfb
array([[ 0.   ,  0.016, ...,  0.   ,  0.   ],
       [ 0.   ,  0.   , ...,  0.   ,  0.   ],
       ...,
       [ 0.   ,  0.   , ...,  0.   ,  0.   ],
       [ 0.   ,  0.   , ...,  0.   ,  0.   ]])
Clip the maximum frequency to 8KHz
>>> librosa.filters.mel(22050, 2048, fmax=8000)
array([[ 0.  ,  0.02, ...,  0.  ,  0.  ],
       [ 0.  ,  0.  , ...,  0.  ,  0.  ],
       ...,
       [ 0.  ,  0.  , ...,  0.  ,  0.  ],
       [ 0.  ,  0.  , ...,  0.  ,  0.  ]])
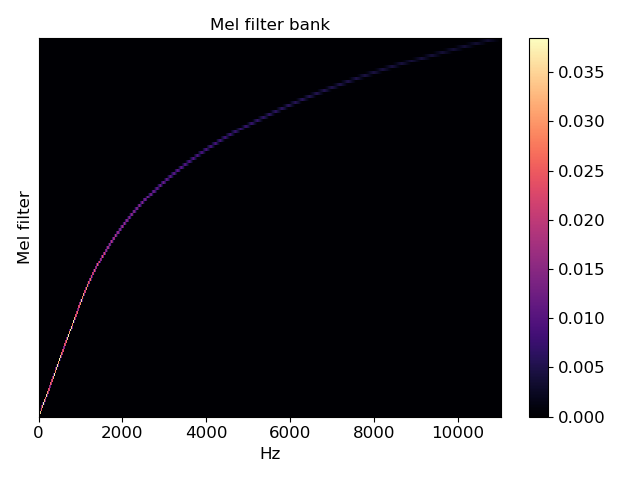
>>> import matplotlib.pyplot as plt
>>> plt.figure()
>>> librosa.display.specshow(melfb, x_axis='linear')
>>> plt.ylabel('Mel filter')
>>> plt.title('Mel filter bank')
>>> plt.colorbar()
>>> plt.tight_layout()