librosa.segment.subsegment
-
librosa.segment.subsegment(data, frames, n_segments=4, axis=-1)[source]¶ Sub-divide a segmentation by feature clustering.
Given a set of frame boundaries (frames), and a data matrix (data), each successive interval defined by frames is partitioned into n_segments by constrained agglomerative clustering.
Note
If an interval spans fewer than n_segments frames, then each frame becomes a sub-segment.
Parameters: - data : np.ndarray
Data matrix to use in clustering
- frames : np.ndarray [shape=(n_boundaries,)], dtype=int, non-negative]
Array of beat or segment boundaries, as provided by
librosa.beat.beat_track,librosa.onset.onset_detect, oragglomerative.- n_segments : int > 0
Maximum number of frames to sub-divide each interval.
- axis : int
Axis along which to apply the segmentation. By default, the last index (-1) is taken.
Returns: - boundaries : np.ndarray [shape=(n_subboundaries,)]
List of sub-divided segment boundaries
See also
agglomerative- Temporal segmentation
librosa.onset.onset_detect- Onset detection
librosa.beat.beat_track- Beat tracking
Notes
This function caches at level 30.
Examples
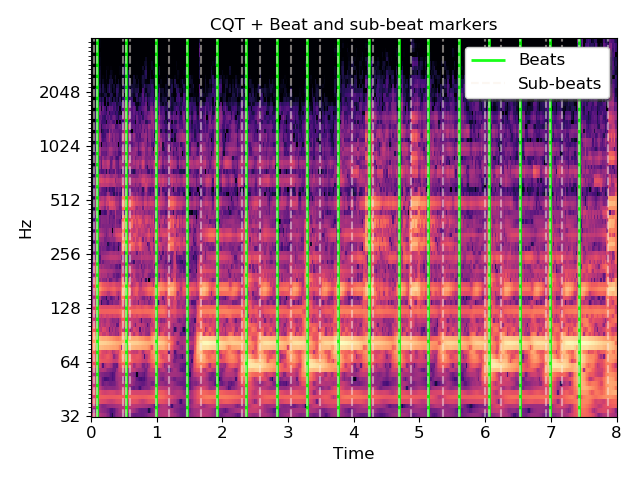
Load audio, detect beat frames, and subdivide in twos by CQT
>>> y, sr = librosa.load(librosa.util.example_audio_file(), duration=8)
>>> tempo, beats = librosa.beat.beat_track(y=y, sr=sr, hop_length=512)
>>> beat_times = librosa.frames_to_time(beats, sr=sr, hop_length=512)
>>> cqt = np.abs(librosa.cqt(y, sr=sr, hop_length=512))
>>> subseg = librosa.segment.subsegment(cqt, beats, n_segments=2)
>>> subseg_t = librosa.frames_to_time(subseg, sr=sr, hop_length=512)
>>> subseg
array([  0,   2,   4,  21,  23,  26,  43,  55,  63,  72,  83,
        97, 102, 111, 122, 137, 142, 153, 162, 180, 182, 185,
       202, 210, 221, 231, 241, 256, 261, 271, 281, 296, 301,
       310, 320, 339, 341, 344, 361, 368, 382, 389, 401, 416,
       420, 430, 436, 451, 456, 465, 476, 489, 496, 503, 515,
       527, 535, 544, 553, 558, 571, 578, 590, 607, 609, 638])
>>> import matplotlib.pyplot as plt
>>> plt.figure()
>>> librosa.display.specshow(librosa.amplitude_to_db(cqt,
...                                                  ref=np.max),
...                          y_axis='cqt_hz', x_axis='time')
>>> lims = plt.gca().get_ylim()
>>> plt.vlines(beat_times, lims[0], lims[1], color='lime', alpha=0.9,
...            linewidth=2, label='Beats')
>>> plt.vlines(subseg_t, lims[0], lims[1], color='linen', linestyle='--',
...            linewidth=1.5, alpha=0.5, label='Sub-beats')
>>> plt.legend(frameon=True, shadow=True)
>>> plt.title('CQT + Beat and sub-beat markers')
>>> plt.tight_layout()