Debug Views
The post-processing stack comes with a selection of debug views to view specific effects or passes such as depth, normals and motion vectors. These can be found at the top of the post-processing profile. Debug views will affect the application of other effects on the Game view.
The debug views included in the post-processing stack are:
Depth
Normals
Motion Vectors
Ambient Occlusion
Eye Adaptation
Focus Plane
Pre Grading Log
Log Lut
User Lut
Properties
| Property: | Function: |
|---|---|
| Mode | The currently selected debug view |
Depth
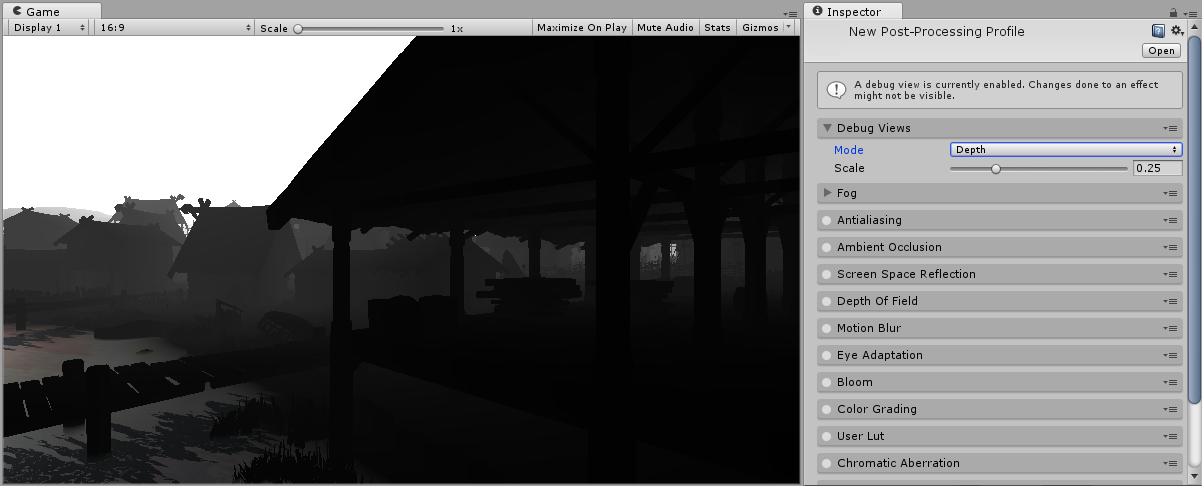
The Depth Debug View displays the depth values of the pixelsThe smallest unit in a computer image. Pixel size depends on your screen resolution. Pixel lighting is calculated at every screen pixel. More info
See in Glossary on screen. These values can be shifted for easier viewing by adjusting the Scale value.
The Debug View can be used to identify issues in all effects that use the depth texture, such as Ambient OcclusionA method to approximate how much ambient lighting (lighting not coming from a specific direction) can hit a point on a surface. More info
See in Glossary and Depth of FieldA post-processing effect that simulates the focus properties of a camera lens. More info
See in Glossary.
Properties
| Property: | Function: |
|---|---|
| Scale | Scales the cameraA component which creates an image of a particular viewpoint in your scene. The output is either drawn to the screen or captured as a texture. More info See in Glossary far plane before displaying the depth map. |
Normals
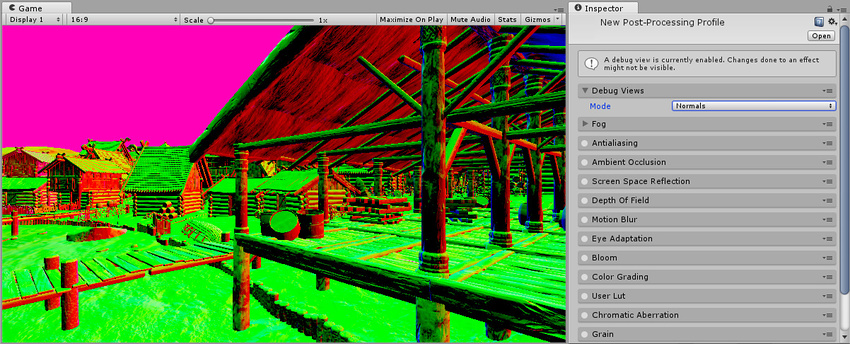
The Normals Debug View displays the normals texture used for various effects. This Debug View differs between renderingThe process of drawing graphics to the screen (or to a render texture). By default, the main camera in Unity renders its view to the screen. More info
See in Glossary paths. In the Deferred rendering path it displays the G-Buffer Normals texture, this includes details from object’s normal maps. In the Forward renderingA rendering path that renders each object in one or more passes, depending on lights that affect the object. Lights themselves are also treated differently by Forward Rendering, depending on their settings and intensity. More info
See in Glossary path it just displays object’s vertex normals.
This Debug View can be used to identify issues in all effects that use the normals texture such as Screen Space Reflection and Ambient Occlusion.

Motion Vectors
The Motion Vectors Debug View displays visualizations of the motion vector texture. There are two types of visualizations in the Motion Vectors Debug View.
The overlay visualization displays motion vector colors of each pixel on screen. Different colors show different movement directions and more saturated values indicate higher velocities. The arrows visualization draws arrows on screen indicating direction and velocity of movement, this is less precise but easier to read.
This Debug View can be used to identify issues with temporal effects such as Motion BlurA common post-processing effect that simulates the blurring of an image when objects filmed by a camera are moving faster than the camera’s exposure time. More info
See in Glossary and Temporal Anti-aliasing.

Properties
| Property: | Function: |
|---|---|
| (Source Image) Opacity | Opacity of the source render. |
| (Motion Vectors (overlay)) Opacity | Opacity of the per-pixel motion vectors |
| (Motion Vectors (overlay)) Amplitude | Because motion vectors are mainly very small vectors, you can use this setting to make them more visible. |
| (Motion Vectors (arrows)) Opacity | Opacity for the motion vector arrows. |
| (Motion Vectors (arrows)) Resolution | The arrow density on screen. |
| (Motion Vectors (arrows)) Amplitude | Tweaks the arrows length. |
Ambient Occlusion
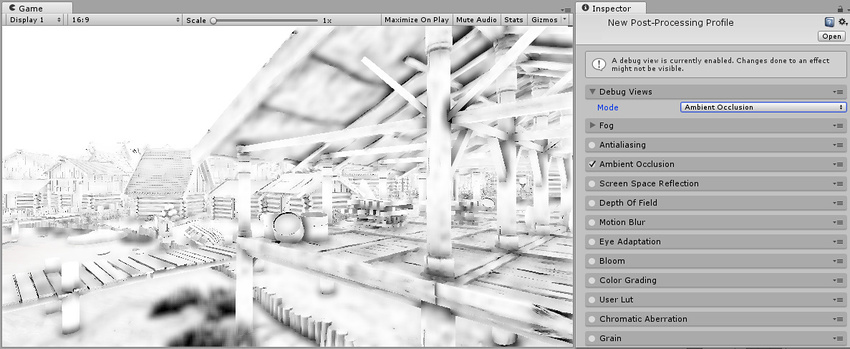
The Ambient Occlusion Debug View displays the final result of the Ambient Occlusion effect without multiplying it on top of the sceneA Scene contains the environments and menus of your game. Think of each unique Scene file as a unique level. In each Scene, you place your environments, obstacles, and decorations, essentially designing and building your game in pieces. More info
See in Glossary. This can be useful for identifying problems in Ambient Occlusion.
Eye Adaptation
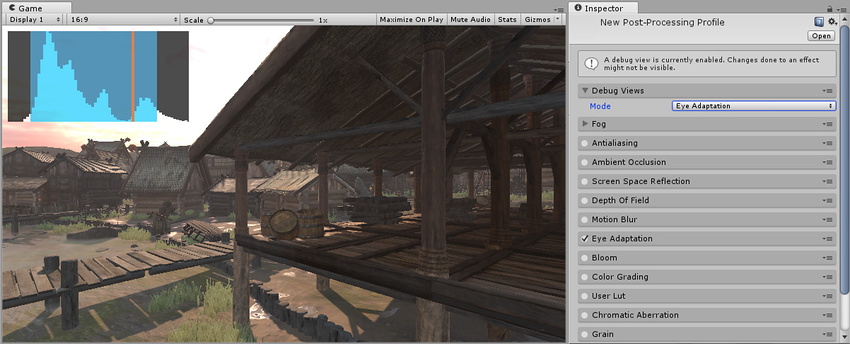
The Eye Adaptation Debug View displays a representation of the histogram used for Eye Adaptation. This indicates the minimum and maximum for Histogram log and Luminance as well as the current average luminance computed by the effect. These are overlaid onto the luminance values of the screen, updated in real time to indicate the Eye Adaptation effect.
This is useful for fine tuning the Eye Adaptation effect.
Focus Plane
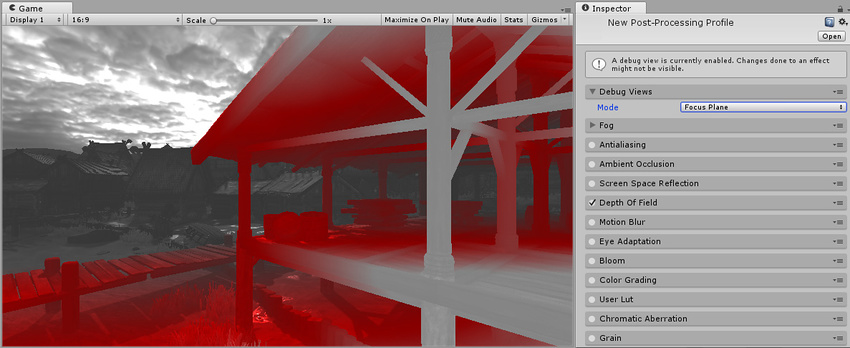
The Focus Plane Debug View displays the focus distance and aperture range used for Depth of Field.
This is useful for setting up the Depth of Field effect.
Pre Grading Log
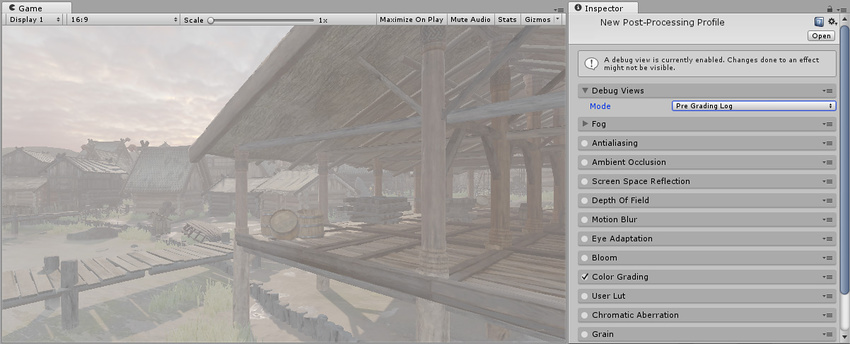
The Pre Grading Log Debug View displays the source image in Log space. This is the input used for most controls of Color Grading. It displays a log/compressed view of the current HDRhigh dymanic range
See in Glossary view.
This is useful for identifying problems in Color Grading.
Log Lut
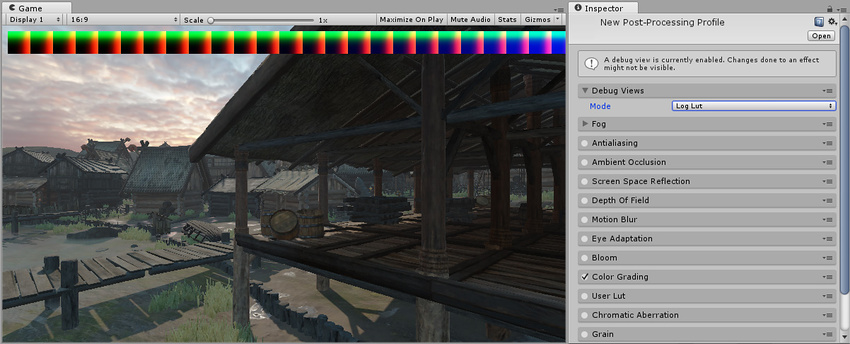
The Log Lut Debug View displays the output Lut for Color Grading. This is the Lut generated by the Color Grading effect based on parameters set by the user.
This is useful for identifying problems in Color Grading.
User Lut
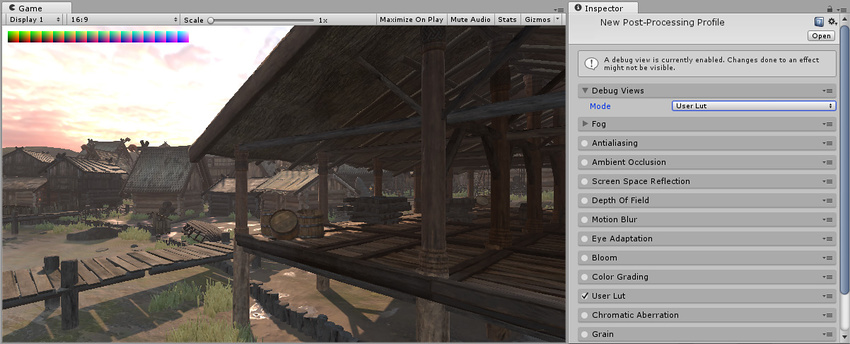
The User Lut Debug View displays the output Lut for User Lut. This is the texture set in the Lut field adjusted by the Contribution parameter.
This is useful for identifying problems in User Lut.
2017–05–24 Page published with no editorial review
New feature in 5.6
Did you find this page useful? Please give it a rating: