librosa.core.stft
-
librosa.core.stft(y, n_fft=2048, hop_length=None, win_length=None, window=’hann’, center=True, dtype=<class ‘numpy.complex64’>, pad_mode=’reflect’)[source]¶ Short-time Fourier transform (STFT)
- Returns a complex-valued matrix D such that
np.abs(D[f, t]) is the magnitude of frequency bin f at frame t
np.angle(D[f, t]) is the phase of frequency bin f at frame t
Parameters: - y : np.ndarray [shape=(n,)], real-valued
the input signal (audio time series)
- n_fft : int > 0 [scalar]
FFT window size
- hop_length : int > 0 [scalar]
number audio of frames between STFT columns. If unspecified, defaults win_length / 4.
- win_length : int <= n_fft [scalar]
Each frame of audio is windowed by window(). The window will be of length win_length and then padded with zeros to match n_fft.
If unspecified, defaults to
win_length = n_fft.- window : string, tuple, number, function, or np.ndarray [shape=(n_fft,)]
- a window specification (string, tuple, or number);
see
scipy.signal.get_window - a window function, such as
scipy.signal.hanning - a vector or array of length n_fft
- a window specification (string, tuple, or number);
see
- center : boolean
- If True, the signal y is padded so that frame D[:, t] is centered at y[t * hop_length].
- If False, then D[:, t] begins at y[t * hop_length]
- dtype : numeric type
Complex numeric type for D. Default is 64-bit complex.
- mode : string
If center=True, the padding mode to use at the edges of the signal. By default, STFT uses reflection padding.
Returns: - D : np.ndarray [shape=(1 + n_fft/2, t), dtype=dtype]
STFT matrix
Notes
This function caches at level 20.
Examples
>>> y, sr = librosa.load(librosa.util.example_audio_file())
>>> D = librosa.stft(y)
>>> D
array([[  2.576e-03 -0.000e+00j,   4.327e-02 -0.000e+00j, ...,
          3.189e-04 -0.000e+00j,  -5.961e-06 -0.000e+00j],
       [  2.441e-03 +2.884e-19j,   5.145e-02 -5.076e-03j, ...,
         -3.885e-04 -7.253e-05j,   7.334e-05 +3.868e-04j],
      ...,
       [ -7.120e-06 -1.029e-19j,  -1.951e-09 -3.568e-06j, ...,
         -4.912e-07 -1.487e-07j,   4.438e-06 -1.448e-05j],
       [  7.136e-06 -0.000e+00j,   3.561e-06 -0.000e+00j, ...,
         -5.144e-07 -0.000e+00j,  -1.514e-05 -0.000e+00j]], dtype=complex64)
Use left-aligned frames, instead of centered frames
>>> D_left = librosa.stft(y, center=False)
Use a shorter hop length
>>> D_short = librosa.stft(y, hop_length=64)
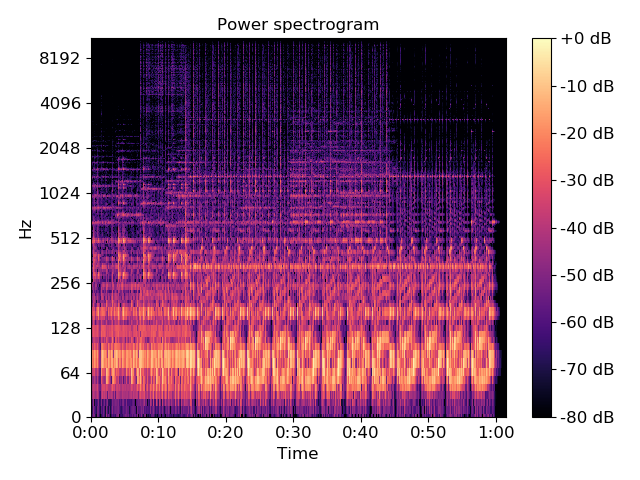
Display a spectrogram
>>> import matplotlib.pyplot as plt
>>> librosa.display.specshow(librosa.amplitude_to_db(D,
...                                                  ref=np.max),
...                          y_axis='log', x_axis='time')
>>> plt.title('Power spectrogram')
>>> plt.colorbar(format='%+2.0f dB')
>>> plt.tight_layout()