librosa.core.iirt
-
librosa.core.iirt(y, sr=22050, win_length=2048, hop_length=None, center=True, tuning=0.0, pad_mode=’reflect’, **kwargs)[source]¶ Time-frequency representation using IIR filters [1].
This function will return a time-frequency representation using a multirate filter bank consisting of IIR filters. First, y is resampled as needed according to the provided sample_rates. Then, a filterbank with with n band-pass filters is designed. The resampled input signals are processed by the filterbank as a whole. (
scipy.signal.filtfiltis used to make the phase linear.) The output of the filterbank is cut into frames. For each band, the short-time mean-square power (STMSP) is calculated by summing win_length subsequent filtered time samples.When called with the default set of parameters, it will generate the TF-representation as described in [1] (pitch filterbank):
- 85 filters with MIDI pitches [24, 108] as center_freqs.
- each filter having a bandwith of one semitone.
[1] (1, 2) Müller, Meinard. “Information Retrieval for Music and Motion.” Springer Verlag. 2007. Parameters: - y : np.ndarray [shape=(n,)]
audio time series
- sr : number > 0 [scalar]
sampling rate of y
- win_length : int > 0, <= n_fft
Window length.
- hop_length : int > 0 [scalar]
Hop length, number samples between subsequent frames. If not supplied, defaults to win_length / 4.
- center : boolean
- If True, the signal y is padded so that frame D[:, t] is centered at y[t * hop_length].
- If False, then D[:, t] begins at y[t * hop_length]
- tuning : float in [-0.5, +0.5) [scalar]
Tuning deviation from A440 in fractions of a bin.
- pad_mode : string
If center=True, the padding mode to use at the edges of the signal. By default, this function uses reflection padding.
- kwargs : additional keyword arguments
Additional arguments for librosa.filters.semitone_filterbank() (e.g., could be used to provide another set of center_freqs and sample_rates).
Returns: - bands_power : np.ndarray [shape=(n, t), dtype=dtype]
Short-time mean-square power for the input signal.
See also
librosa.filters.semitone_filterbank,librosa.filters._multirate_fb,librosa.filters.mr_frequencies,librosa.core.cqt,scipy.signal.filtfiltExamples
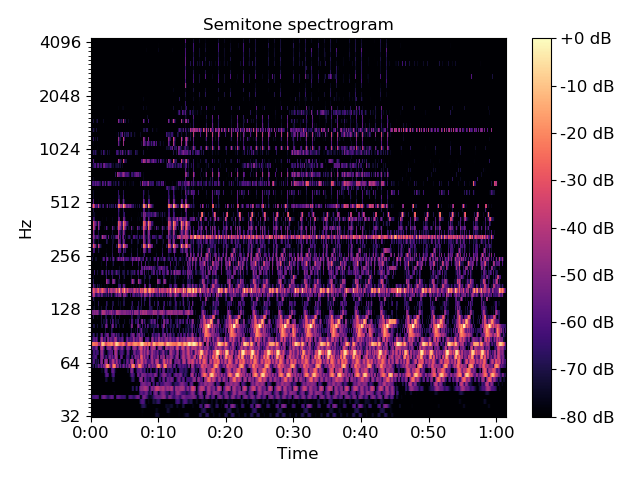
>>> import matplotlib.pyplot as plt
>>> y, sr = librosa.load(librosa.util.example_audio_file())
>>> D = librosa.iirt(y)
>>> librosa.display.specshow(librosa.amplitude_to_db(D, ref=np.max),
...                          y_axis='cqt_hz', x_axis='time')
>>> plt.title('Semitone spectrogram')
>>> plt.colorbar(format='%+2.0f dB')
>>> plt.tight_layout()