librosa.segment.timelag_filter
-
librosa.segment.timelag_filter(function, pad=True, index=0)[source]¶ Filtering in the time-lag domain.
This is primarily useful for adapting image filters to operate on
recurrence_to_lagoutput.Using
timelag_filteris equivalent to the following sequence of operations:>>> data_tl = librosa.segment.recurrence_to_lag(data) >>> data_filtered_tl = function(data_tl) >>> data_filtered = librosa.segment.lag_to_recurrence(data_filtered_tl)
Parameters: - function : callable
The filtering function to wrap, e.g.,
scipy.ndimage.median_filter- pad : bool
Whether to zero-pad the structure feature matrix
- index : int >= 0
If function accepts input data as a positional argument, it should be indexed by index
Returns: - wrapped_function : callable
A new filter function which applies in time-lag space rather than time-time space.
Examples
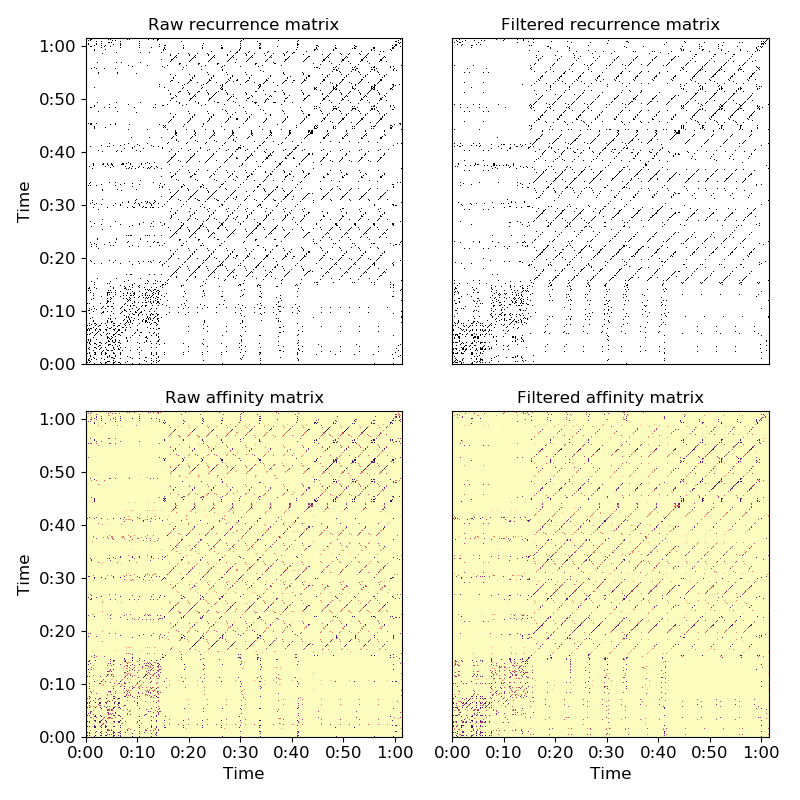
Apply a 5-bin median filter to the diagonal of a recurrence matrix
>>> y, sr = librosa.load(librosa.util.example_audio_file())
>>> chroma = librosa.feature.chroma_cqt(y=y, sr=sr)
>>> rec = librosa.segment.recurrence_matrix(chroma)
>>> from scipy.ndimage import median_filter
>>> diagonal_median = librosa.segment.timelag_filter(median_filter)
>>> rec_filtered = diagonal_median(rec, size=(1, 3), mode='mirror')
Or with affinity weights
>>> rec_aff = librosa.segment.recurrence_matrix(chroma, mode='affinity')
>>> rec_aff_fil = diagonal_median(rec_aff, size=(1, 3), mode='mirror')
>>> import matplotlib.pyplot as plt
>>> plt.figure(figsize=(8,8))
>>> plt.subplot(2, 2, 1)
>>> librosa.display.specshow(rec, y_axis='time')
>>> plt.title('Raw recurrence matrix')
>>> plt.subplot(2, 2, 2)
>>> librosa.display.specshow(rec_filtered)
>>> plt.title('Filtered recurrence matrix')
>>> plt.subplot(2, 2, 3)
>>> librosa.display.specshow(rec_aff, x_axis='time', y_axis='time',
...                          cmap='magma_r')
>>> plt.title('Raw affinity matrix')
>>> plt.subplot(2, 2, 4)
>>> librosa.display.specshow(rec_aff_fil, x_axis='time',
...                          cmap='magma_r')
>>> plt.title('Filtered affinity matrix')
>>> plt.tight_layout()