Collect Docker metrics with Prometheus
Estimated reading time: 8 minutesPrometheus is an open-source systems monitoring and alerting toolkit. You can configure Docker as a Prometheus target. This topic shows you how to configure Docker, set up Prometheus to run as a Docker container, and monitor your Docker instance using Prometheus.
Warning: The available metrics and the names of those metrics are in active development and may change at any time.
Currently, you can only monitor Docker itself. You cannot currently monitor your application using the Docker target.
Configure Docker
To configure the Docker daemon as a Prometheus target, you need to specify the
metrics-address. The best way to do this is via the daemon.json, which is
located at one of the following locations by default. If the file does not
exist, create it.
- Linux:
/etc/docker/daemon.json - Windows Server:
C:\ProgramData\docker\config\daemon.json - Docker Desktop for Mac / Docker Desktop for Windows: Click the Docker icon in the toolbar, select Preferences, then select Daemon. Click Advanced.
If the file is currently empty, paste the following:
{
  "metrics-addr" : "127.0.0.1:9323",
  "experimental" : true
}
If the file is not empty, add those two keys, making sure that the resulting
file is valid JSON. Be careful that every line ends with a comma (,) except
for the last line.
Save the file, or in the case of Docker Desktop for Mac or Docker Desktop for Windows, save the configuration. Restart Docker.
Docker now exposes Prometheus-compatible metrics on port 9323.
Configure and run Prometheus
Prometheus runs as a Docker service on a Docker swarm.
Prerequisites
One or more Docker engines are joined into a Docker swarm, using
docker swarm initon one manager anddocker swarm joinon other managers and worker nodes.You need an internet connection to pull the Prometheus image.
Copy one of the following configuration files and save it to
/tmp/prometheus.yml (Linux or Mac) or C:\tmp\prometheus.yml (Windows). This
is a stock Prometheus configuration file, except for the addition of the Docker
job definition at the bottom of the file. Docker Desktop for Mac and Docker Desktop for Windows
need a slightly different configuration.
# my global config
global:
  scrape_interval:     15s # Set the scrape interval to every 15 seconds. Default is every 1 minute.
  evaluation_interval: 15s # Evaluate rules every 15 seconds. The default is every 1 minute.
  # scrape_timeout is set to the global default (10s).

  # Attach these labels to any time series or alerts when communicating with
  # external systems (federation, remote storage, Alertmanager).
  external_labels:
      monitor: 'codelab-monitor'

# Load rules once and periodically evaluate them according to the global 'evaluation_interval'.
rule_files:
  # - "first.rules"
  # - "second.rules"

# A scrape configuration containing exactly one endpoint to scrape:
# Here it's Prometheus itself.
scrape_configs:
  # The job name is added as a label `job=<job_name>` to any timeseries scraped from this config.
  - job_name: 'prometheus'

    # metrics_path defaults to '/metrics'
    # scheme defaults to 'http'.

    static_configs:
      - targets: ['localhost:9090']

  - job_name: 'docker'
         # metrics_path defaults to '/metrics'
         # scheme defaults to 'http'.

    static_configs:
      - targets: ['localhost:9323']
# my global config
global:
  scrape_interval:     15s # Set the scrape interval to every 15 seconds. Default is every 1 minute.
  evaluation_interval: 15s # Evaluate rules every 15 seconds. The default is every 1 minute.
  # scrape_timeout is set to the global default (10s).

  # Attach these labels to any time series or alerts when communicating with
  # external systems (federation, remote storage, Alertmanager).
  external_labels:
      monitor: 'codelab-monitor'

# Load rules once and periodically evaluate them according to the global 'evaluation_interval'.
rule_files:
  # - "first.rules"
  # - "second.rules"

# A scrape configuration containing exactly one endpoint to scrape:
# Here it's Prometheus itself.
scrape_configs:
  # The job name is added as a label `job=<job_name>` to any timeseries scraped from this config.
  - job_name: 'prometheus'

    # metrics_path defaults to '/metrics'
    # scheme defaults to 'http'.

    static_configs:
      - targets: ['docker.for.mac.localhost:9090']

  - job_name: 'docker'
         # metrics_path defaults to '/metrics'
         # scheme defaults to 'http'.

    static_configs:
      - targets: ['docker.for.mac.host.internal:9323']
# my global config
global:
  scrape_interval:     15s # Set the scrape interval to every 15 seconds. Default is every 1 minute.
  evaluation_interval: 15s # Evaluate rules every 15 seconds. The default is every 1 minute.
  # scrape_timeout is set to the global default (10s).

  # Attach these labels to any time series or alerts when communicating with
  # external systems (federation, remote storage, Alertmanager).
  external_labels:
      monitor: 'codelab-monitor'

# Load rules once and periodically evaluate them according to the global 'evaluation_interval'.
rule_files:
  # - "first.rules"
  # - "second.rules"

# A scrape configuration containing exactly one endpoint to scrape:
# Here it's Prometheus itself.
scrape_configs:
  # The job name is added as a label `job=<job_name>` to any timeseries scraped from this config.
  - job_name: 'prometheus'

    # metrics_path defaults to '/metrics'
    # scheme defaults to 'http'.

    static_configs:
      - targets: ['docker.for.win.localhost:9090']

  - job_name: 'docker'
         # metrics_path defaults to '/metrics'
         # scheme defaults to 'http'.

    static_configs:
      - targets: ['192.168.65.1:9323']
Next, start a single-replica Prometheus service using this configuration.
$ docker service create --replicas 1 --name my-prometheus \
    --mount type=bind,source=/tmp/prometheus.yml,destination=/etc/prometheus/prometheus.yml \
    --publish published=9090,target=9090,protocol=tcp \
    prom/prometheus
$ docker service create --replicas 1 --name my-prometheus \
    --mount type=bind,source=/tmp/prometheus.yml,destination=/etc/prometheus/prometheus.yml \
    --publish published=9090,target=9090,protocol=tcp \
    prom/prometheus
PS C:\> docker service create --replicas 1 --name my-prometheus
    --mount type=bind,source=C:/tmp/prometheus.yml,destination=/etc/prometheus/prometheus.yml
    --publish published=9090,target=9090,protocol=tcp
    prom/prometheus
Verify that the Docker target is listed at http://localhost:9090/targets/.
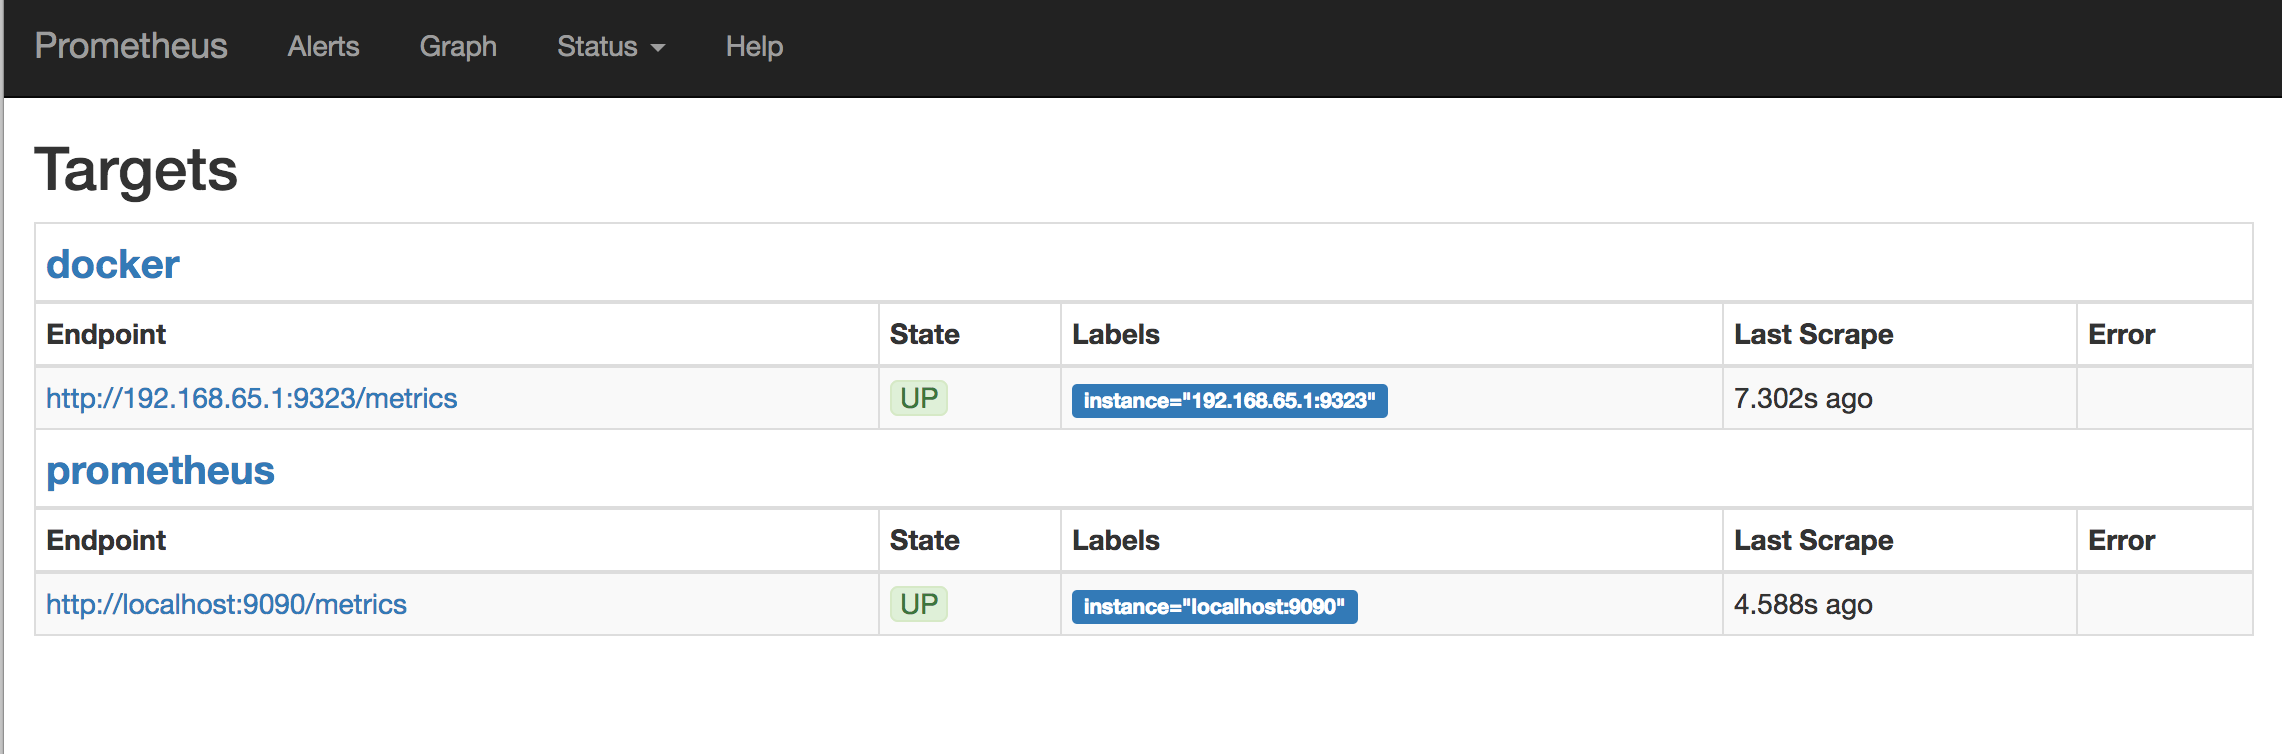
You can’t access the endpoint URLs directly if you use Docker Desktop for Mac or Docker Desktop for Windows.
Use Prometheus
Create a graph. Click the Graphs link in the Prometheus UI. Choose a metric
from the combo box to the right of the Execute button, and click
Execute. The screenshot below shows the graph for
engine_daemon_network_actions_seconds_count.
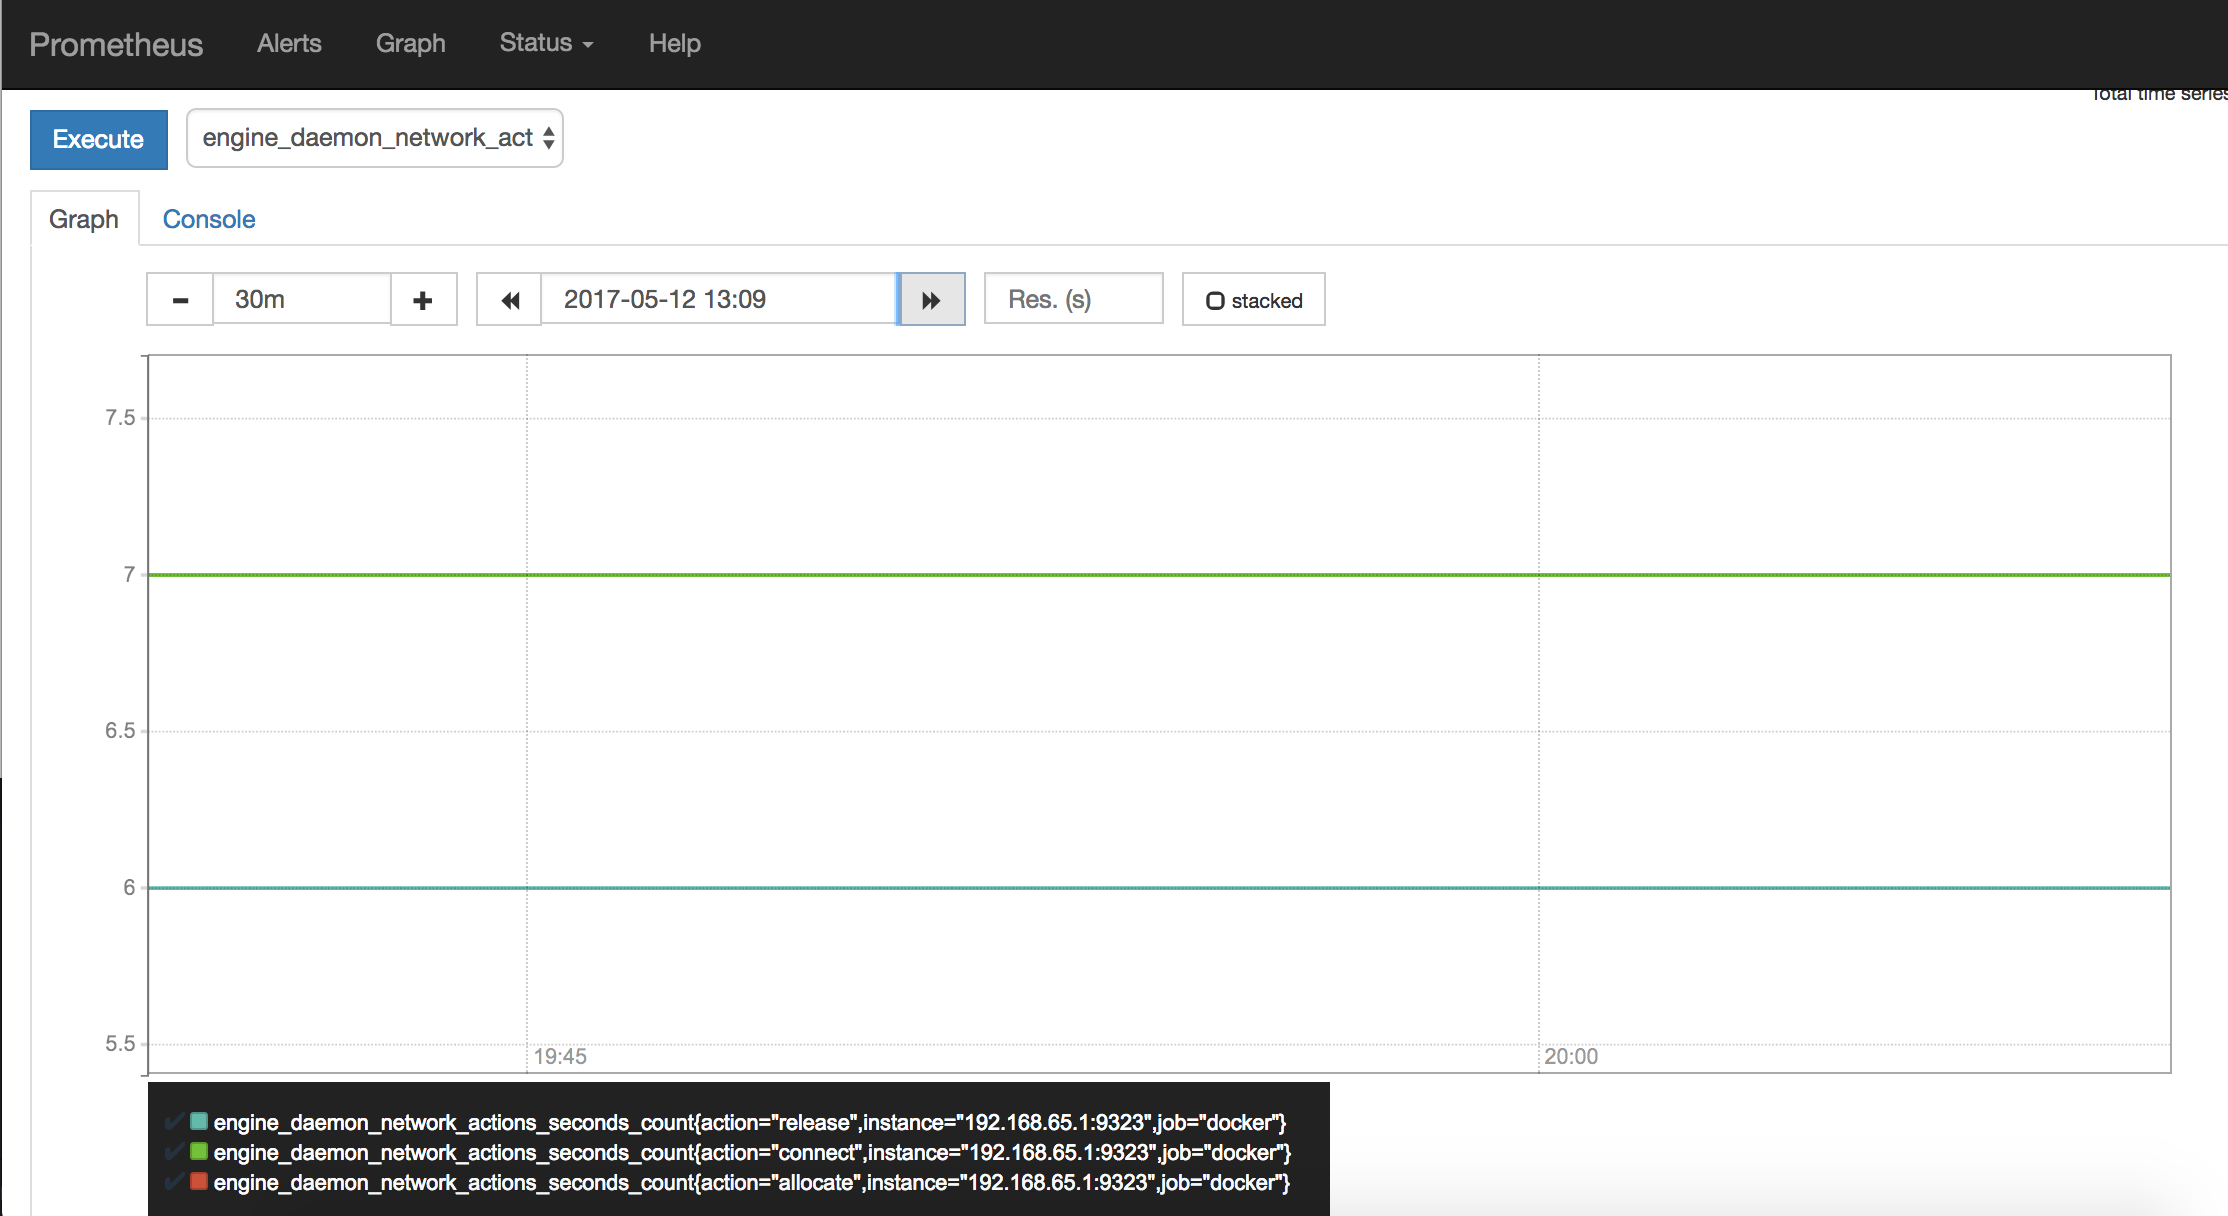
The above graph shows a pretty idle Docker instance. Your graph might look different if you are running active workloads.
To make the graph more interesting, create some network actions by starting a service with 10 tasks that just ping Docker non-stop (you can change the ping target to anything you like):
$ docker service create \
  --replicas 10 \
  --name ping_service \
  alpine ping docker.com
Wait a few minutes (the default scrape interval is 15 seconds) and reload your graph.
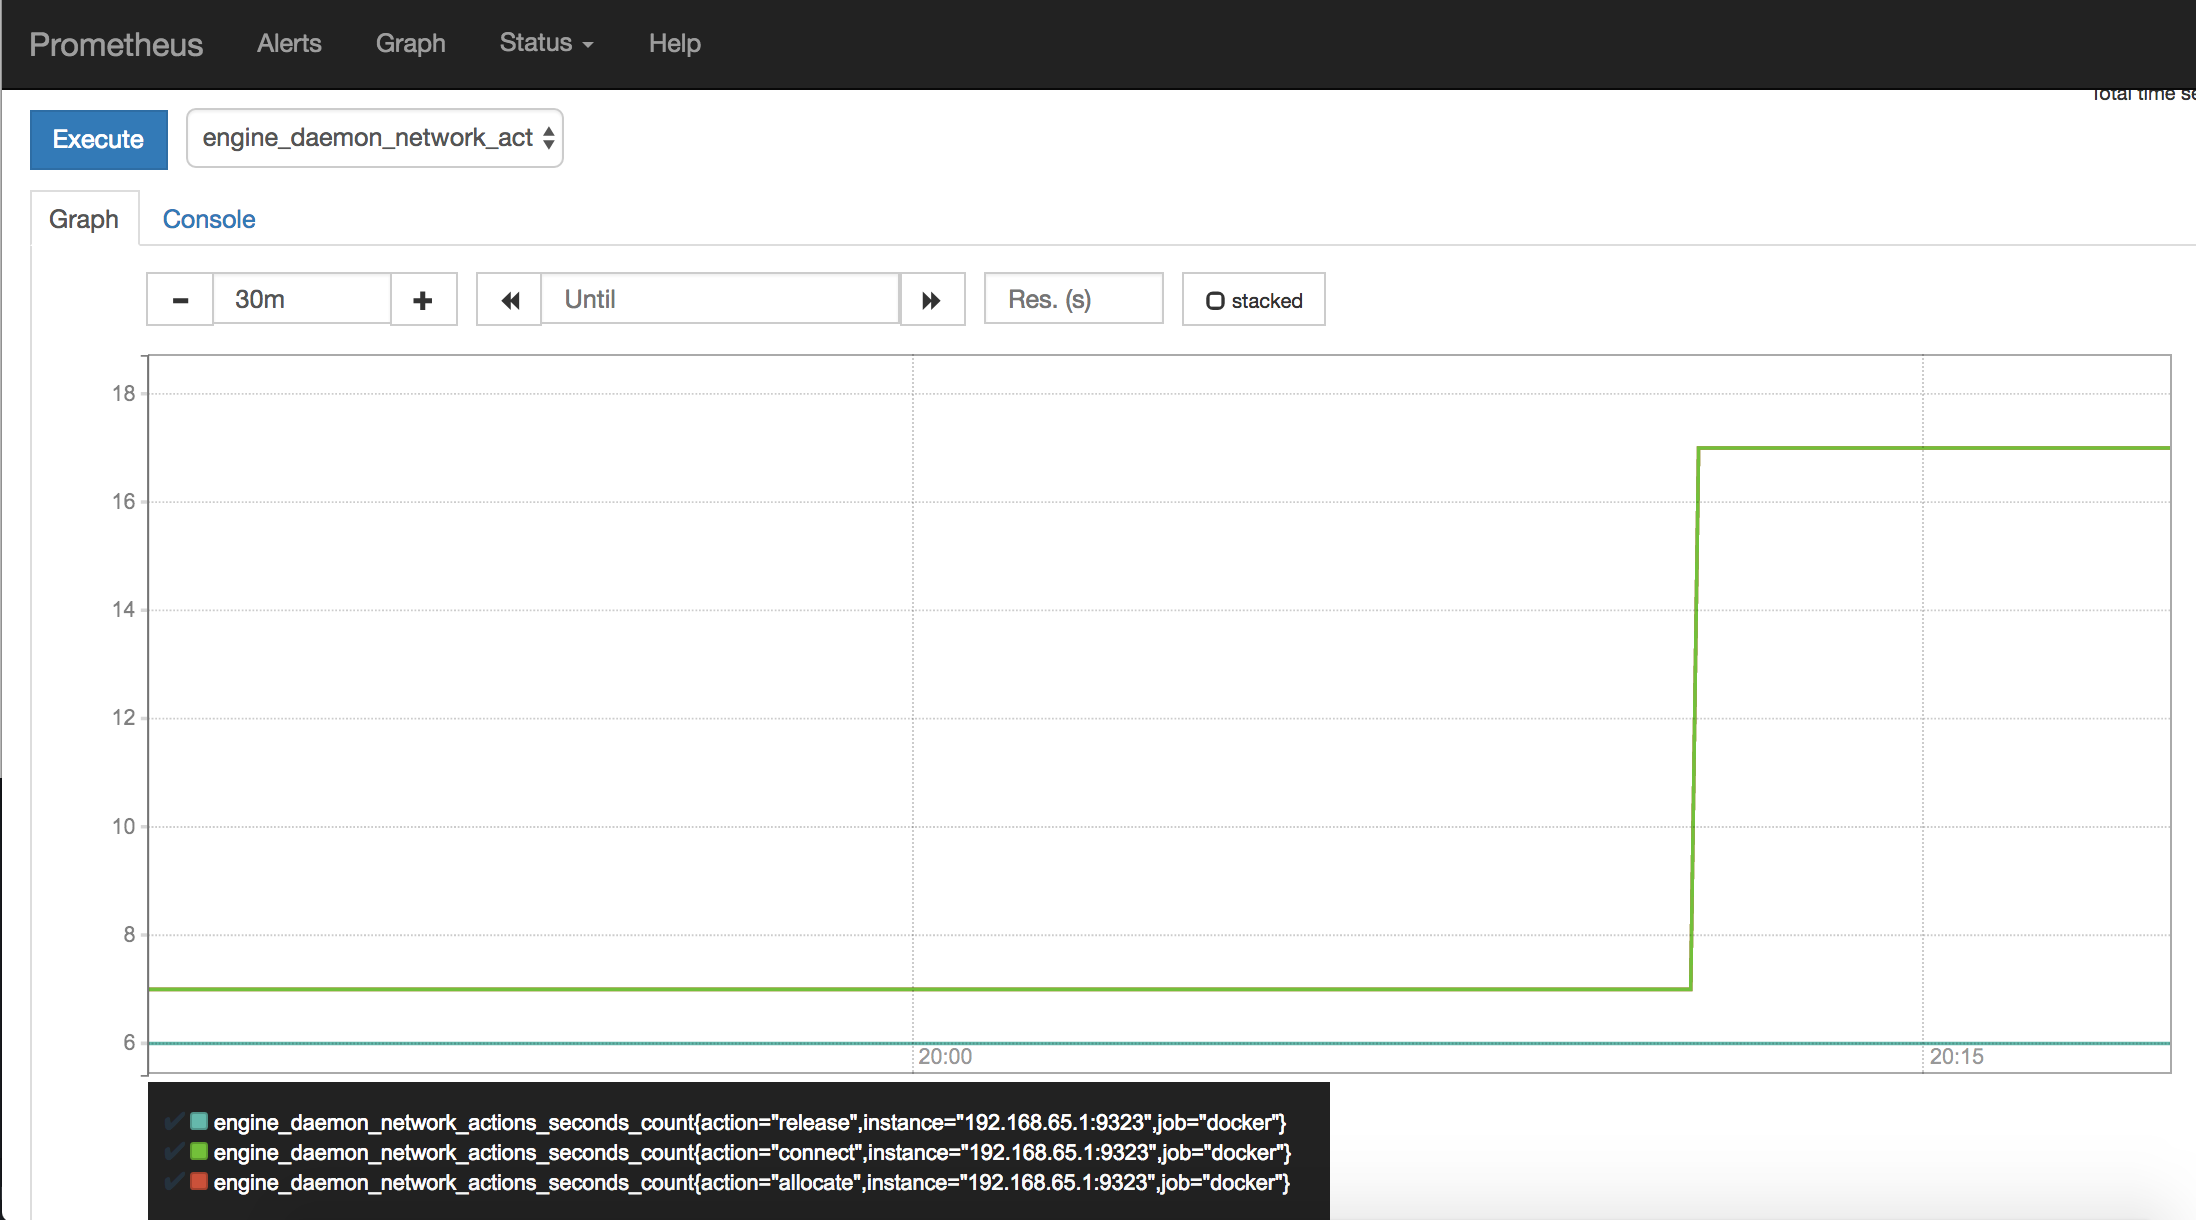
When you are ready, stop and remove the ping_service service, so that you
are not flooding a host with pings for no reason.
$ docker service remove ping_service
Wait a few minutes and you should see that the graph falls back to the idle level.
Next steps
- Read the Prometheus documentation
- Set up some alerts