
Chef Analytics Webui
Note
This documentation is meant to support existing Chef customers using Analytics.
If you are a new Chef customer, or are looking to gain better insight into your fleet, try Chef Automate. You’ll get a graphical interface and query language that gives you insight into operational, compliance, and workflow events. Download Chef Automate here.
The Chef server gathers a lot of data. For example:
- Changes made to each node object
- The run history for all nodes
- The history of every cookbook (and cookbook version)
- How and where policy settings—roles, environments, and data bags—are applied
- Which users made which changes
The Chef Analytics server collects all of this data and makes it visible from the Chef Analytics user interface.
Chef Analytics tracks all of this data in real-time, which then helps you answer the following types of questions:
- Which object changed?
- What type of change was made?
- When was this change made?
- Who changed it?
For example, Chef Analytics can tell you things like:
- The date and time on which a specific user uploaded a cookbook from their local workstation to the Chef server
- The date and time at which a cookbook stopped working
- The changes that were made to the system immediately before that cookbook stopped working
This type of information can be used to quickly identify where in the overall system something changed, which in turn helps identify what went wrong, and then helps show your organization what the resolution should be.
Chef Analytics can also tell you things like:
- What happened just before one (or more) chef-client runs started failing?
- Which versions of SSH are on which machines?
- Is each system updated for the latest patch?
- When did the depsolver break? Which changes happened immediately prior?
Because Chef Analytics tracks all of this in real-time, your organization will be able to use Chef Analytics to react to events as they happen and to more quickly resolve issues that may arise.
The Chef Analytics web user interface is installed as part of Chef analytics.
Note
This feature is included as part of the Chef Automate license agreement and is available via subscription.
Architecture
The following diagram shows the major components of Chef Analytics and how the various actions relate to the major components of the Chef server. Chef Analytics uses a publish-subscribe messaging platform for components to publish messages about interesting events that are happening within each public API. The pub/sub platform provides some standard consumers of the information, including a database archiving component and web visualization. The data is searchable and stored long term for after-the-fact investigation and audit purposes.
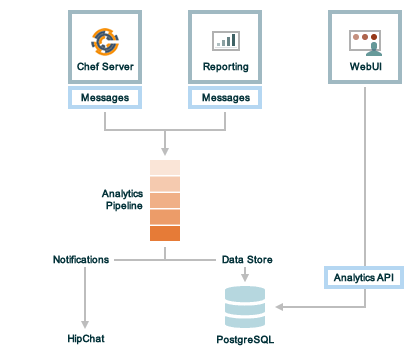
As events occur on the Chef server, the following happens:
| Stages | Description |
|---|---|
| Chef Server | Chef Analytics tracks all interactions from users (via knife and/or the Chef management console web user interface), the chef-client (via API calls to the Chef server during the chef-client run), cookbooks that are uploaded to the server, downloaded to individual nodes, the actions the chef-client takes on each node during the chef-client run). |
| WebUI | The web user interface for Chef Analytics. It provides visibility into every action tracked by Chef Analytics, allows searching of the actions data store, and can be used to generate reports (CSV files, send emails, and so on). |
| Actions Pipeline | The Chef Analytics pipeline is used to parse each action as it is tracked, tagging each action with the appropriate tags, identifying which notifications (if any) should be sent for each specific action, identifying any custom actions (if any) that should be taken against each specific action, and then archiving each action to the data store. |
| Notifications | Chef Analytics includes a few built-in notification engines: HipChat and email. Custom engines can be integrated using a simple webhook architecture via HTTP. |
| Data Store | The data store is a PostgreSQL database that is used to store all of the actions that are tracked by Chef Analytics. Users of the Chef Analytics web user interface interact with the data in the data store via the Actions API. |
Data Tracking
Chef Analytics tracks the following types of data:
- The name organization in which the event occurred, e.g. “chef”
- The hostname for the node from which the request was initiated, e.g. “computer.chef.io” or “some.node.FQDN.com”
- A unique identifier for the request, e.g. the chef-client run identifier for events generated during a chef-client run or the Reporting run identifier for events generated during reporting
- The name of the entity that made the request, e.g. “grantmc”
- The type of entity, e.g. “user”
- The interface from which the request was initiated, e.g. knife, Chef management console, and so on, including the version for that interface
- The requested action; this typically maps to a specific method in the Chef server API, such as
create,read,update, anddelete - The Chef server object and type, e.g. “cookbook” and “apache” (for a cookbook named “apache”)
- The version (and version number) for the Chef server object, e.g. “version” and “1.2.3”
- The date and time at which the event happened
User Interface
The Chef Analytics user interface allows you to:
- View actions on any Chef object. See changes to a node or role to track down bugs.
- View actions for an organization. See all the actions in a production organization to measure the level of change at different times of the day and week.
- Navigate to the Chef management console console. There’s one-click to access an object in the management console from the Chef Analytics page.
- Fan-out messages for distribution. Send notifications from Chef to HipChat when cookbooks or roles have been uploaded.
- Distinguish between knife, chef-client, and other clients. View the different types of client applications accessing the Chef server to spot unusual or unexpected behavior.
- Correlate calls from a single client invocation. Group all the items that happened during a single client (e.g. chef-client, knife) invocation.
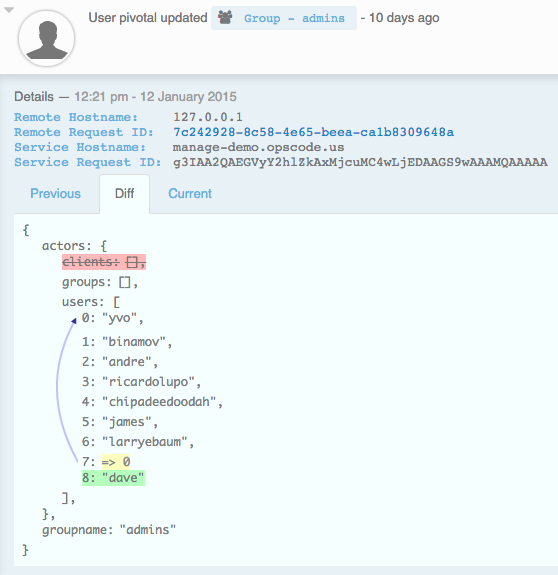
- Browse actions for after-the-fact investigation. A persistent log can be saved on demand for auditing purposes or for analyzing information after an event has occurred. All messages are immutable. Non-modifiable messages are delivered reliably to the actions database. They can be used as a trusted source of data about changes to your infrastructure.
View diffs of Chef actions:
Enable Auto-Refresh
Update the actions log view automatically using auto-refresh.
To enable auto-refresh mode:
Open Chef Analytics.
Click the auto-refresh button.

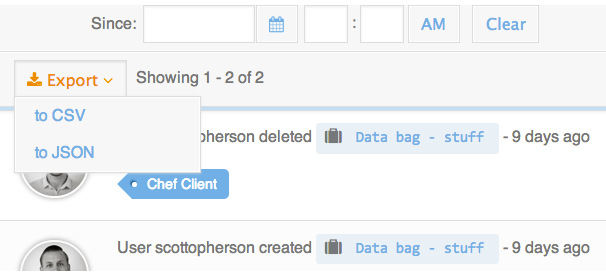
Export Actions
The actions in Chef Analytics may be exported as a JSON document or a CSV file.
To export an action list:
Open Chef Analytics.
Click the Export drop-down.
Choose JSON or CSV.
Choose the location in which the exported action list is to be saved.
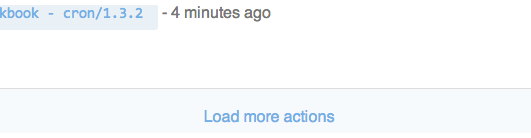
Load More Actions
The actions view is paginated. Scroll to the bottom of the list. Click the Load more actions link to load the next page.
To load more actions:
Open Chef Analytics.
Scroll down and click Load more actions.
Log In
To log on to Chef Analytics use the same user name and password for the Chef server that is associated with Chef Analytics.
Save Search Query
Any search query may be saved for use later.
To save a search query:
Open Chef Analytics.
Click the Save drop-down.
Enter a name for the search query.
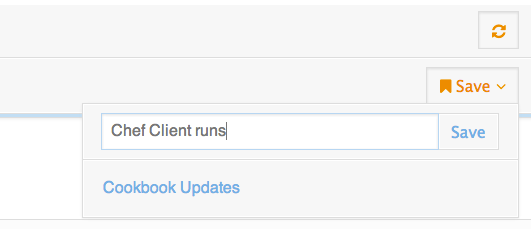
Click Save.
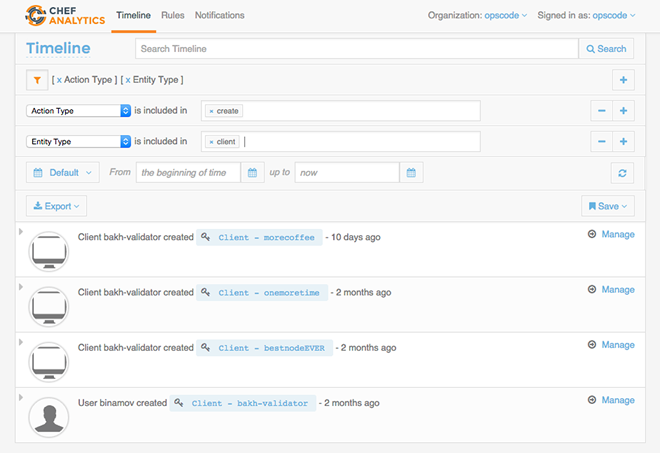
Search Actions
Actions can be searched by name. Use filters for entity name, entity type, action type, remote request identifier, and tag. Most filter fields auto-complete from a list of possible values. Use wildcard searches and data ranges to fine-tune search results.
To search actions:
Open Chef Analytics.
Choose a filter. (Most filter fields will auto-complete with a list of possible values.)
Use
Action Typeto filter for the type of action, such as create, update, or delete.Use
Entity Nameto filter by Chef server object name, such as cookbook, data bag, or role.Use
Entity Typeto filter by Chef server object type, such as client, cookbook version, or role.Use
Remote Request IDto filter by chef-client run identifier that is reported back to Chef Analytics by Reporting. This filter is useful for correlating actions that have occurred during specific chef-client runs.Use
Tagsto filter by user-defined tags. Each user agent that performs an action—knife, Berkshelf, chef-client, Chef management console—is assigned a tag.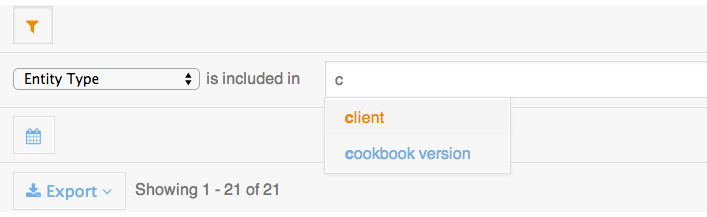
Choose a date range. There are three options: after the specified date, before the specified date, or within a specified date range.
Switch Orgs
You can switch between organizations in a similar manner to the Chef Analytics to see actions for a particular organization.
To switch organizations:
Open Chef Analytics.
Next to Organization, choose the new organization from the drop-down.
A newly-created or newly-associated organization may not appear in the drop-down list. If this occurs, log out of Chef Analytics, and then log back in. This will refresh the list of organizations.
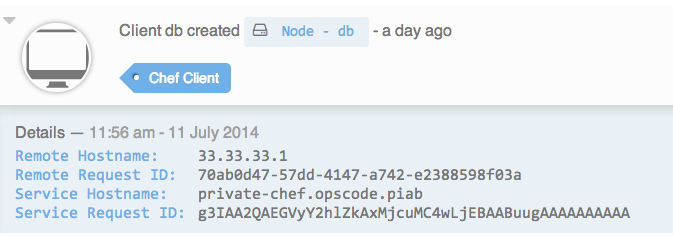
View Action Details
The actions view always shows the most recent actions, including a one-line summary of what happened. For example: “Client dg created node - db a day ago.” Each action in the view may be expanded to show action details, including the name and request identifier of the chef-client and the name of the Chef server instances involved in the action.
Every user in Chef Analytics has a picture that is associated with the entry that is created as a result of an action they perform. For the chef-client, it’s a picture of a computer screen (always). And for users, the images are fetched from gravatar.com, based on the email address associated with that user. If that user has uploaded a picture to gravatar.com, that picture will be used.
To view action details:
Open Chef Analytics.
Choose an action and expand it.