
Chef Analytics Tasks
Note
This documentation is meant to support existing Chef customers using Analytics.
If you are a new Chef customer, or are looking to gain better insight into your fleet, try Chef Automate. You’ll get a graphical interface and query language that gives you insight into operational, compliance, and workflow events. Download Chef Automate here.
The Chef Analytics user interface allows you to:
- View actions on any Chef object. See changes to a node or role to track down bugs.
- View actions for an organization. See all the actions in a production organization to measure the level of change at different times of the day and week.
- Navigate to the Chef management console console. There’s one-click to access an object in the management console from the Chef Analytics page.
- Fan-out messages for distribution. Send notifications from Chef to HipChat when cookbooks or roles have been uploaded.
- Distinguish between knife, chef-client, and other clients. View the different types of client applications accessing the Chef server to spot unusual or unexpected behavior.
- Correlate calls from a single client invocation. Group all the items that happened during a single client (e.g. chef-client, knife) invocation.
- Browse actions for after-the-fact investigation. A persistent log can be saved on demand for auditing purposes or for analyzing information after an event has occurred. All messages are immutable. Non-modifiable messages are delivered reliably to the actions database. They can be used as a trusted source of data about changes to your infrastructure.
This topic is an alphabetical list of the various tasks that can be performed when using the Chef Analytics.
Note
This feature is included as part of the Chef Automate license agreement and is available via subscription.
Enable Auto-Refresh Mode
Update the actions log view automatically using auto-refresh.
To enable auto-refresh mode:
Open Chef Analytics.
Click the auto-refresh button.

Export Actions
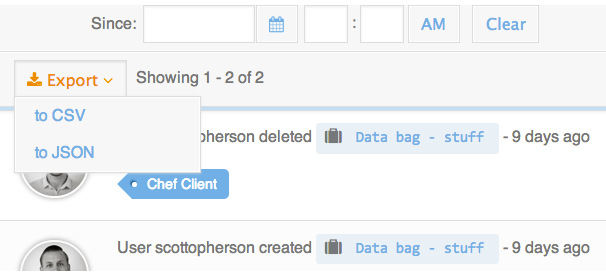
The actions in Chef Analytics may be exported as a JSON document or a CSV file.
To export an action list:
Open Chef Analytics.
Click the Export drop-down.
Choose JSON or CSV.
Choose the location in which the exported action list is to be saved.
Load More Actions
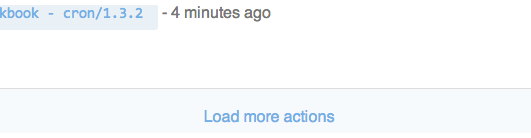
The actions view is paginated. Scroll to the bottom of the list. Click the Load more actions link to load the next page.
To load more actions:
Open Chef Analytics.
Scroll down and click Load more actions.
Log In
To log on to Chef Analytics use the same user name and password for the Chef server that is associated with Chef Analytics.
Save Search Query
Any search query may be saved for use later.
To save a search query:
Open Chef Analytics.
Click the Save drop-down.
Enter a name for the search query.
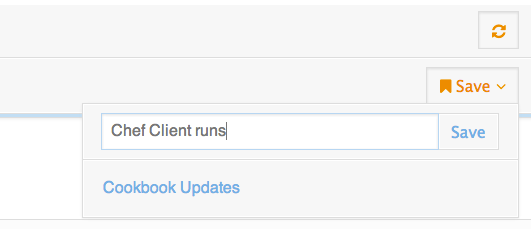
Click Save.
Search Actions
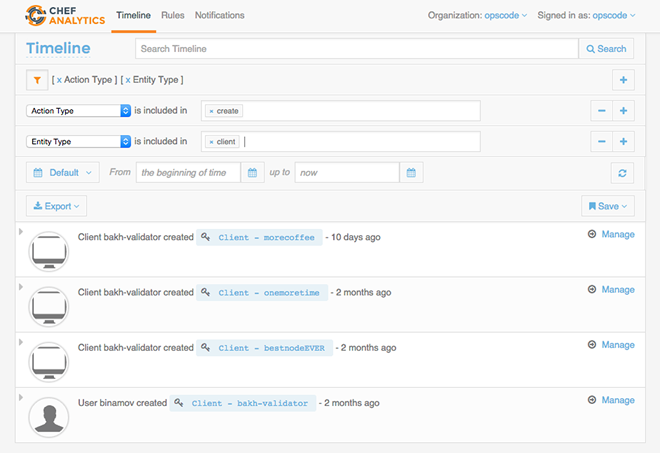
Actions can be searched by name. Use filters for entity name, entity type, action type, remote request identifier, and tag. Most filter fields auto-complete from a list of possible values. Use wildcard searches and data ranges to fine-tune search results.
To search actions:
Open Chef Analytics.
Choose a filter. (Most filter fields will auto-complete with a list of possible values.)
Use
Action Typeto filter for the type of action, such as create, update, or delete.Use
Entity Nameto filter by Chef server object name, such as cookbook, data bag, or role.Use
Entity Typeto filter by Chef server object type, such as client, cookbook version, or role.Use
Remote Request IDto filter by chef-client run identifier that is reported back to Chef Analytics by Reporting. This filter is useful for correlating actions that have occurred during specific chef-client runs.Use
Tagsto filter by user-defined tags. Each user agent that performs an action—knife, Berkshelf, chef-client, Chef management console—is assigned a tag.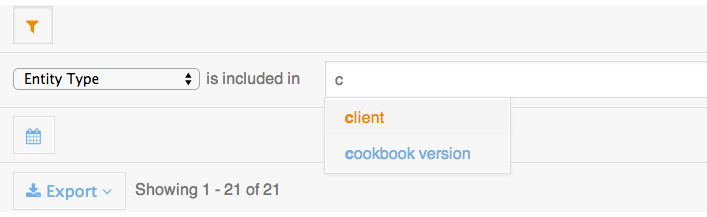
Choose a date range. There are three options: after the specified date, before the specified date, or within a specified date range.
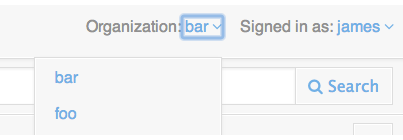
Switch Orgs
You can switch between organizations in a similar manner to the Chef Analytics to see actions for a particular organization.
To switch organizations:
Open Chef Analytics.
Next to Organization, choose the new organization from the drop-down.
A newly-created or newly-associated organization may not appear in the drop-down list. If this occurs, log out of Chef Analytics, and then log back in. This will refresh the list of organizations.
View Action Details
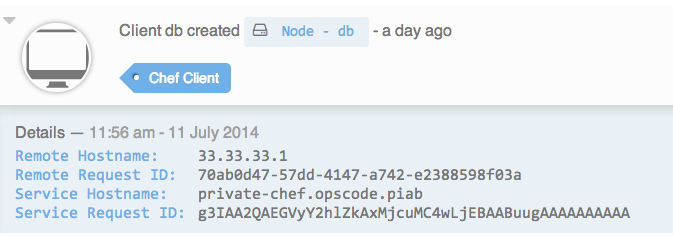
The actions view always shows the most recent actions, including a one-line summary of what happened. For example: “Client dg created node - db a day ago.” Each action in the view may be expanded to show action details, including the name and request identifier of the chef-client and the name of the Chef server instances involved in the action.
Every user in Chef Analytics has a picture that is associated with the entry that is created as a result of an action they perform. For the chef-client, it’s a picture of a computer screen (always). And for users, the images are fetched from gravatar.com, based on the email address associated with that user. If that user has uploaded a picture to gravatar.com, that picture will be used.
To view action details:
Open Chef Analytics.
Choose an action and expand it.