Monitor your cluster
Estimated reading time: 2 minutesThis article gives you an overview of how to monitor your Docker UCP cluster and how to troubleshoot if something goes wrong.
Check the cluster status from the UI
To monitor your UCP cluster, the first thing to check is the Nodes screen on the UCP web app.
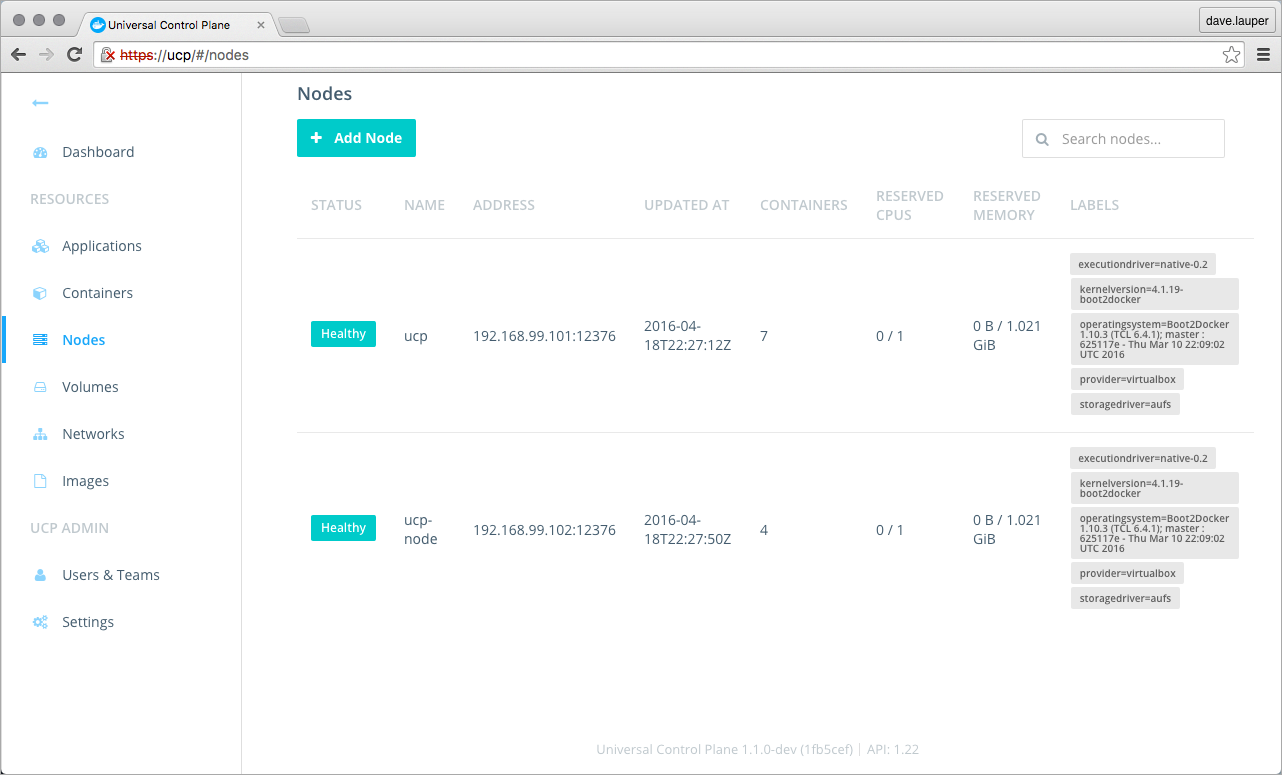
In the nodes screen you can see if all the nodes in the cluster are healthy, or if there is any problem.
You can also check the state of individual UCP containers by navigating to the Containers page. By default the Containers screen doesn’t display system containers. On the filter dropdown choose Show all containers to see all the UCP components.
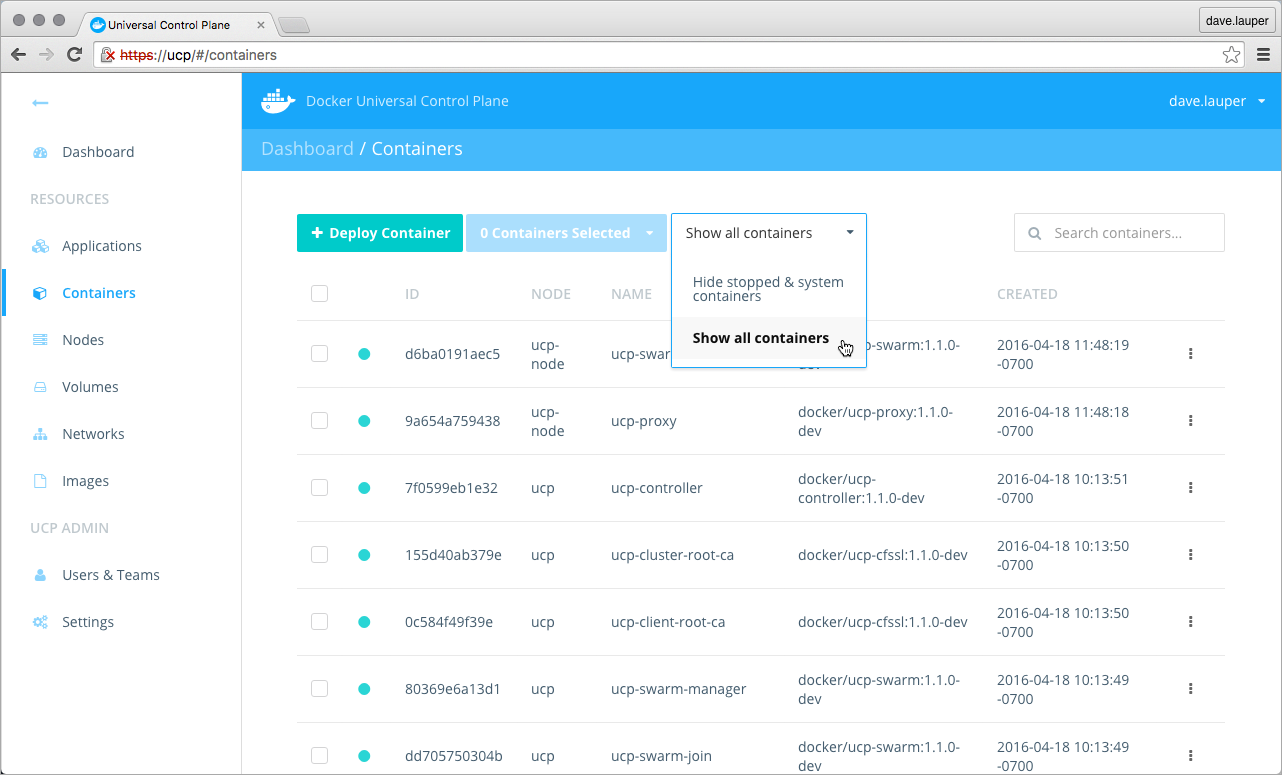
You can click on a container to see more details like configurations and logs.
Check the cluster status from the CLI
You can also monitor the status of a UCP cluster, using the Docker CLI client.
-
Get a client certificate bundle.
When using the Docker CLI client you need to authenticate using client certificates. Learn how to use client certificates.
If your client certificate bundle is for a non-admin user, you don’t have permissions to execute all docker commands, or see all information about the cluster.
-
Use the
docker infocommand to check the cluster status.$ docker info Containers: 11 Nodes: 2 ucp: 192.168.99.100:12376 └ Status: Healthy ucp-node: 192.168.99.101:12376 └ Status: Healthy Cluster Managers: 1 192.168.99.104: Healthy └ Orca Controller: https://192.168.99.100:443 └ Swarm Manager: tcp://192.168.99.100:3376 └ KV: etcd://192.168.99.100:12379 -
Check the container logs
With an admin user certificate bundle, you can run docker commands directly on the Docker Engine or Swarm Manager of a node. In this example, we are connecting directly to the Docker Engine running on the UCP controller, and requesting the logs of the ucp-kv container.
$ docker -H tcp://192.168.99.101:12376 logs ucp-kv

2016-04-18 22:40:51.553912 I | etcdserver: start to snapshot (applied: 40004, lastsnap: 30003)
2016-04-18 22:40:51.561682 I | etcdserver: saved snapshot at index 40004
2016-04-18 22:40:51.561927 I | etcdserver: compacted raft log at 35004